1. Introduction
This document describes the user interface of the VILT - Minium Manager, version 2.7.7.
Minium Manager is a web testing automation platform designed to asure your platforms and applications perform as intended across several combination of browsers and OS’s on a continuous integration fashion. If something is not working as expected, Minium Manager can send you notifications and can also record videos so you can easily identify problems, and also provides access to detailed reports on test executions and its results. With Minium Manager it is easy to write and manage tests: writing new tests gets almost as easy as writing English and test management is very straightforward.
With the purpose of giving you a way of asuring the quality of your platforms and applications, it provides you with different types of projects that can focus on different components of an application, such as usability, availability and performance. By allowing you to design more focused tests you can guarantee the robustness of you platforms and applications with Minium Manager
2. Projects
Configure projects in Minium Manager, in order to run and analyze end-to-end tests.
All projects need to have a repository (Git or SVN) associated, where the code is stored, except the Cookie Crawler.
There are three type of projects: Web application testing, Monitoring and Cookie.
The Web application testing project is a Minium project that navigates a website in the same way a human would.
The Monitoring project is a Minium project that are executed with high frequency (every 5, 10, 20 minutes), and can give us a report about the availability of a certain page and performance metrics, with the objective to check that the page are working as expected.
The development workflow for a Monitoring project in Minium Developer will be similar to the web application testing project, providing an easy and quick way to write test. The configuration in Minium Manager is similar to other projects. The monitoring project does not have the browser configuration.
The Cookie project generates a report of cookies found during the navigation or crawl of a website. The Cookie is divided in two projects: Cookie Report project and Cookie Crawler project. The Cookie Report project is a Minium project (based on the monitoring project) that extracts the all browser cookies at the end of a scenario. The Cookie Crawler project is a crawler that given one or more URLs, it crawls the websites and, for each URL, extracts the all browser cookies.
2.1. Monitoring
To start the development of a monitoring project, you need to check the checkbox Is a Monitoring Project? to generate the monitoring project:
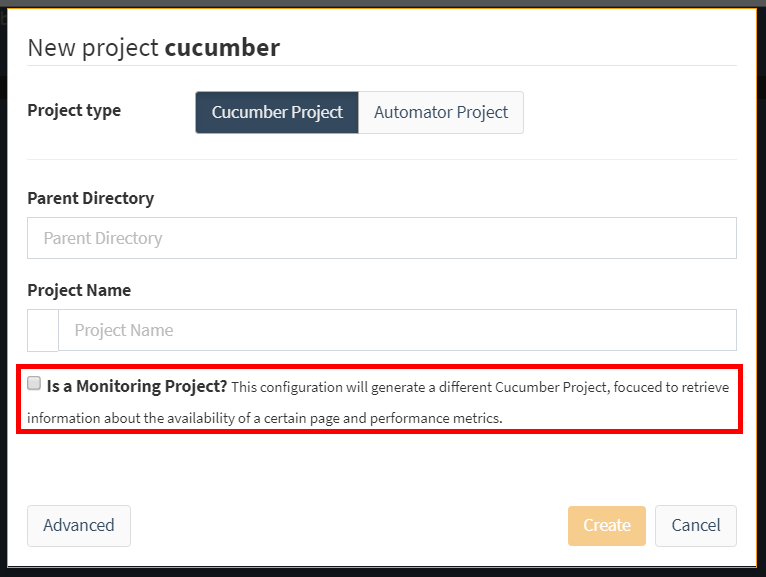
Here are some examples of the development workflow in Minium Developer of the monitoring project:
2.1.1. Check if the website is ok
Use case: You want to test if the URL is ok and get the performance in the reports
Scenario:
Scenario: Check Blog La caixa
  When Check if website responds: "https://blog.caixabank.es/"
Step:
When(/^Check if website responds: "([^"]*)"$/, function(url) {
  browser.get(url);
});
For a monitoring project, the expression browser.get(url); retrieves the data related to page load performance, the URL status, the number of requests, the page size and javascript errors. This information will be presented at the Minium Manager report.
2.1.2. Do a search on the website with refresh and check how long it took to load.
Use case: You want to perform a search on the website (where’s there’s a refresh after the search) and check if the results appear and get the performance of the page.
Scenario:
Scenario: Search
    Given I'm at "https://www.caixabank.es/particular/home/particulares_es.html"
    When Search for "CaixaBank" and check the results
Steps:
When(/^I'm at "([^"]*)"$/, function(url) {
  browser.get(url);
});

When(/^Search for "([^"]*)" and check the results$/, function(search) {
  $("#cookies-accept-full a").click();
  $("#search-field").fill(search);
  $("#prebuscadorCabecera input[type='submit']").click();
  expect($(".search-result-block")).to.exist();
  scenario.write(browser.getPerformance());
});
The expression scenario.write(browser.getPerformance()); retrieves and store the data related to the last page load performance, the URL status, the number of requests, the page size and javascript errors. This information will be presented at the Minium Manager report.
2.1.3. Click on a link and get the performance of the page
When(/^I click on link with text "([^"]*)"$/, function(text) {
 $("a").withText(text).click();
 expect($(".page-title")).to.exist();
 scenario.write(browser.getPerformance());
});
2.2. Cookie
Since the Cookie Report project is a Minium project (based on the monitoring project), to create a Cookie Report project, simply generate a Monitoring project in Minium Developer. It is not necessary to add extra instructions to the minium code, since all browser cookies will be automatically extracted at the end of each scenario.
For the Cookie Crawler project, development is not necessary, you only need to provide one or more URLs to crawl.
2.3. Setup a project
To set up a project, click on the button New Project:
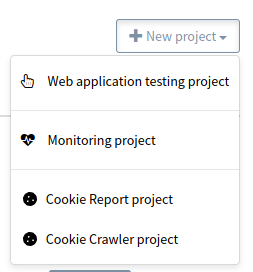
There are 4 project types we can select:
-
Web application testing project
-
Monitoring project
-
Cookie Report project
-
Cookie Crawler project
Then, fill the form:
2.3.1. General
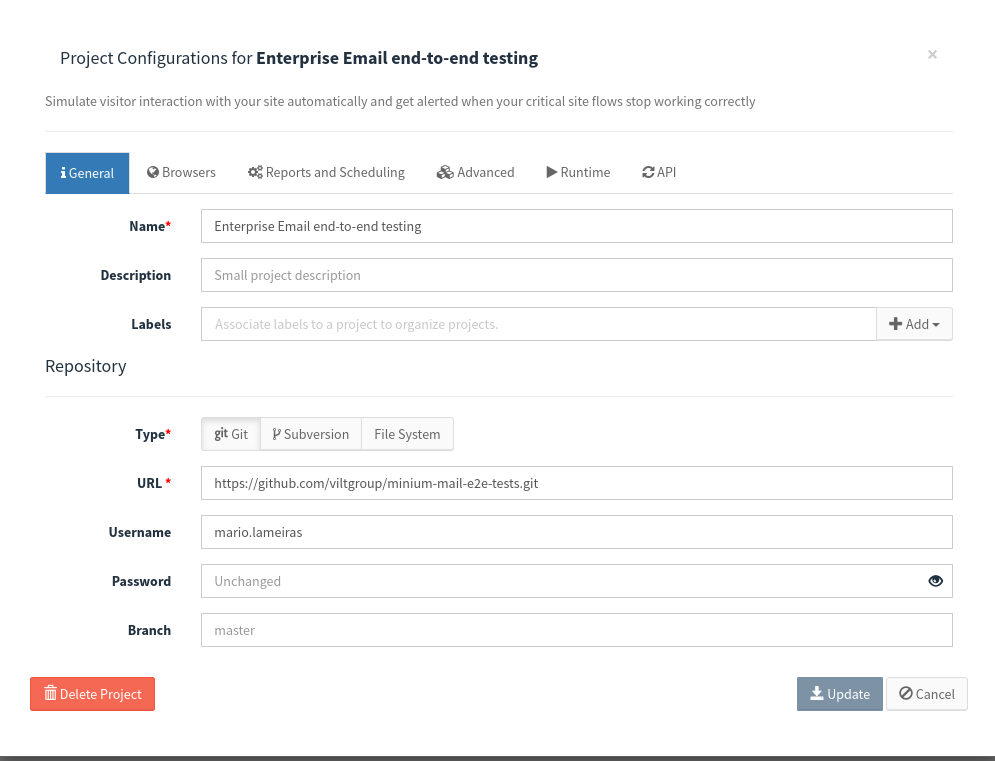
On the General tab, fill the following fields:
Name |
Display name of the project (e.g gmail-e2e-tests) |
Description |
Optionally provide a project description |
Labels |
Associated labels to a project in order to organize and filter projects. |
Type |
Type of SCM repository |
Url |
URL of the repository where the project with the features is stored (GIT and Subversion only). The following are examples of valid git URL’s (or a local file path): https://github.com/github/git.git //path-to-repo/repos/gmail-e2e-tests |
Username/Password |
Credentials for authentication on the repository (GIT and Subversion only). |
Branch |
The name of the branch you want to execute (GIT only). The default value is |
Code |
Upload one archive zip with the minium project (File system only). If no archive zip is uploaded, Minium Manager will use the template projects. |
Download Zip |
Downloads the current minium project (File system only). |
Edit |
Opens the editor to edit the minium project (File system only). |
Cookie Crawler
For the Cookie Crawler project the General tab is different:
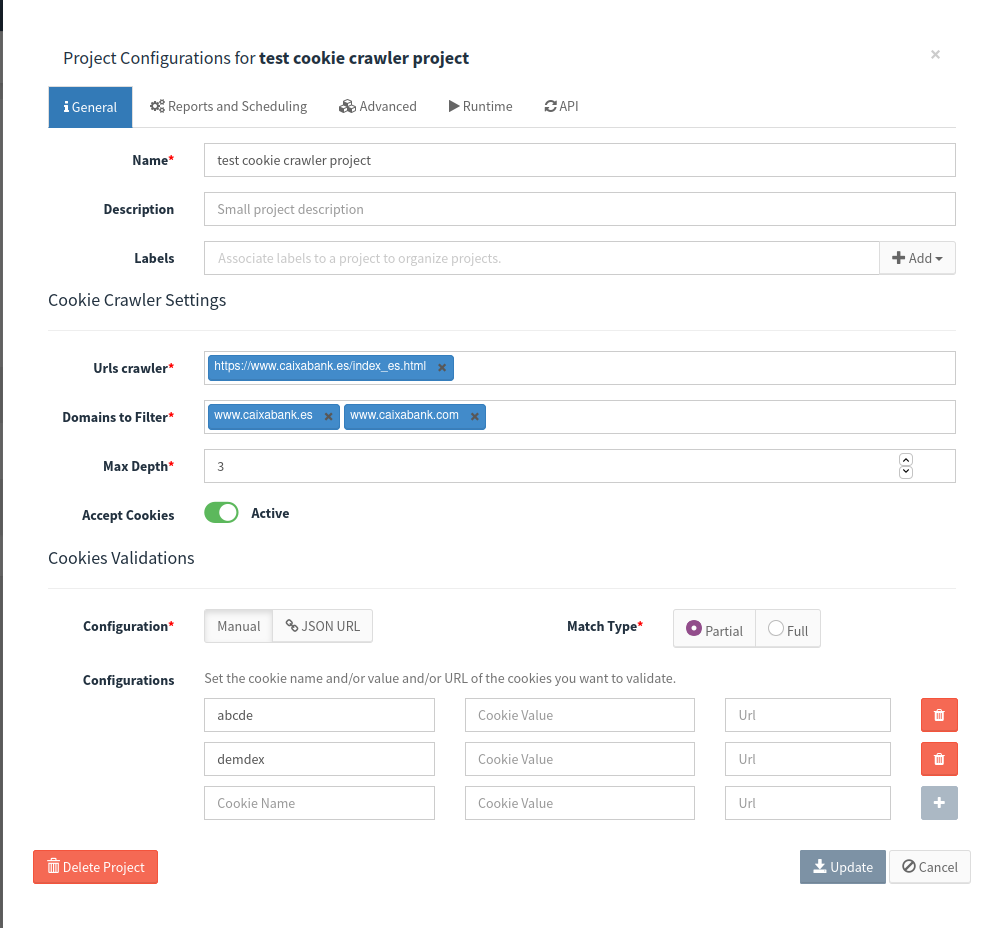
Urls crawler |
The URLs you want to crawl (e.g. |
Domains to Filter |
The domains you want to filter at the crawl (e.g. |
Max Depth |
Maximum depth for the crawler to follow links automatically |
Accept Cookies |
Accept the cookie warning during the crawl (is related to the field |
Configuration |
The type of configuration to validate the cookies. The |
Match Type |
The type of match that will be used to validate the cookies. The |
Configurations |
the cookie name and/or value and/or URL of the cookies you want to validate. After you configure one validation, click at the button |
JSON URL |
Add the url to the json that contains the cookies to validate. |
2.3.2. Browsers
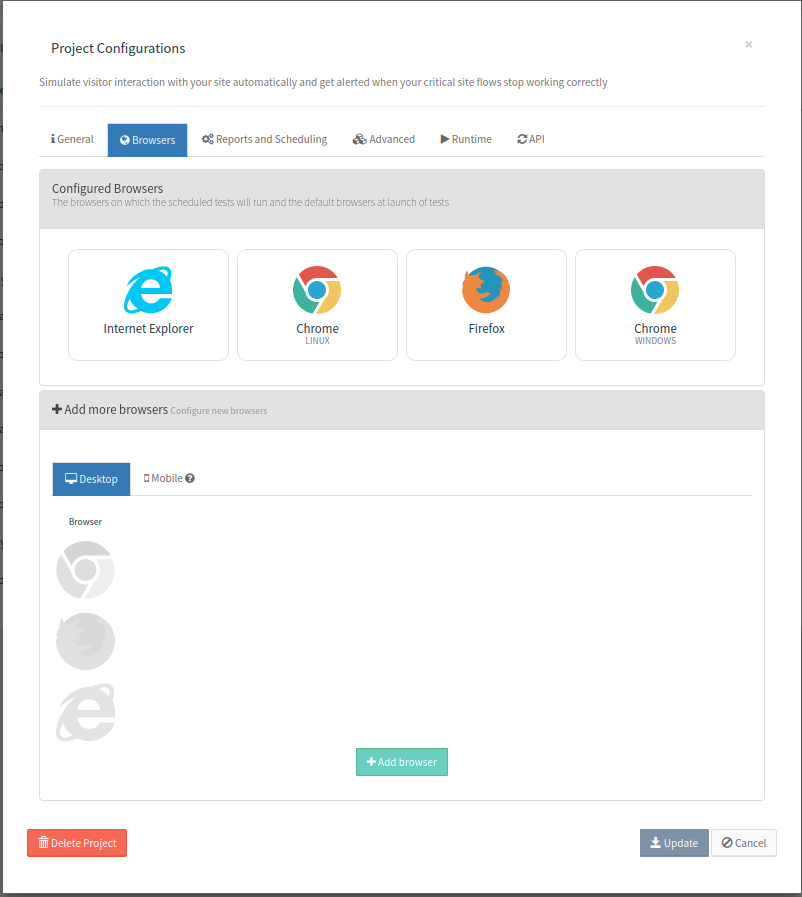
On the Browsers tab, choose the browsers on which the scheduled tests will run, and the default browsers at launch of tests.
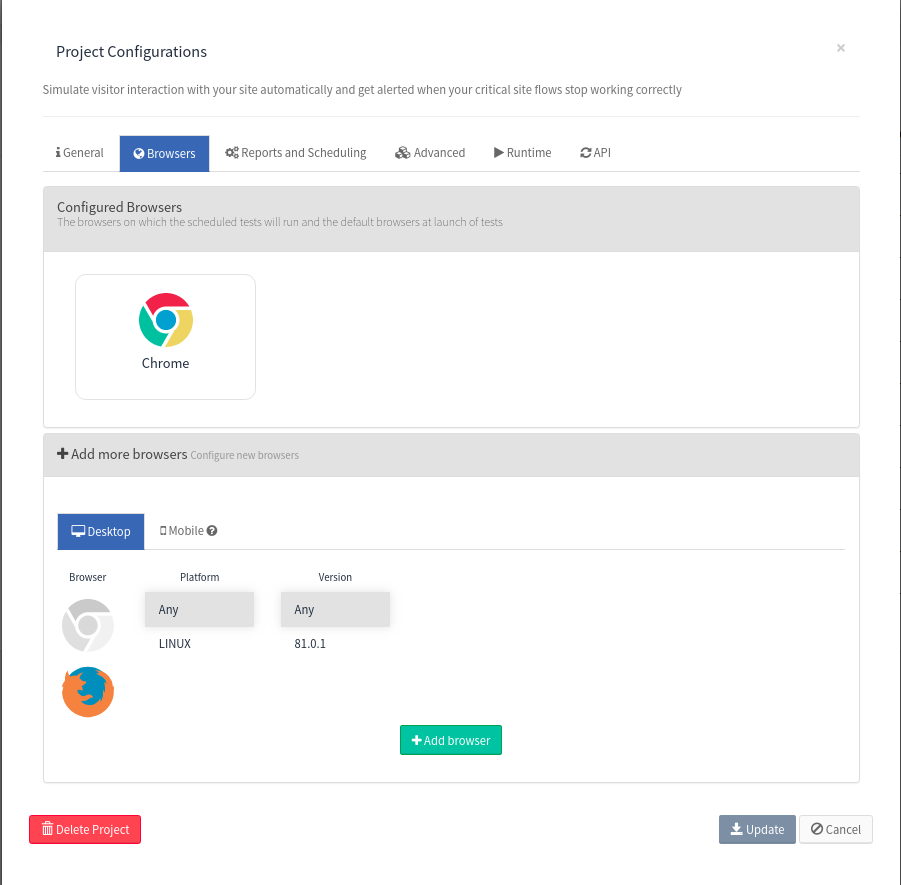
To configure the browsers, click Add more browsers to expand the available browsers and select a browser (and the properties) and/or the mobile devices (emulated via chrome). After, click Add browser or Add device (for mobile devices).
If you want to remove a configured browser, move the mouse over the browser configuration (below the configured browsers) and click on the trash icon.
|
Note:
The Browsers tab is not available for the monitoring and cookie projects.
|
2.3.3. Reports and Scheduling
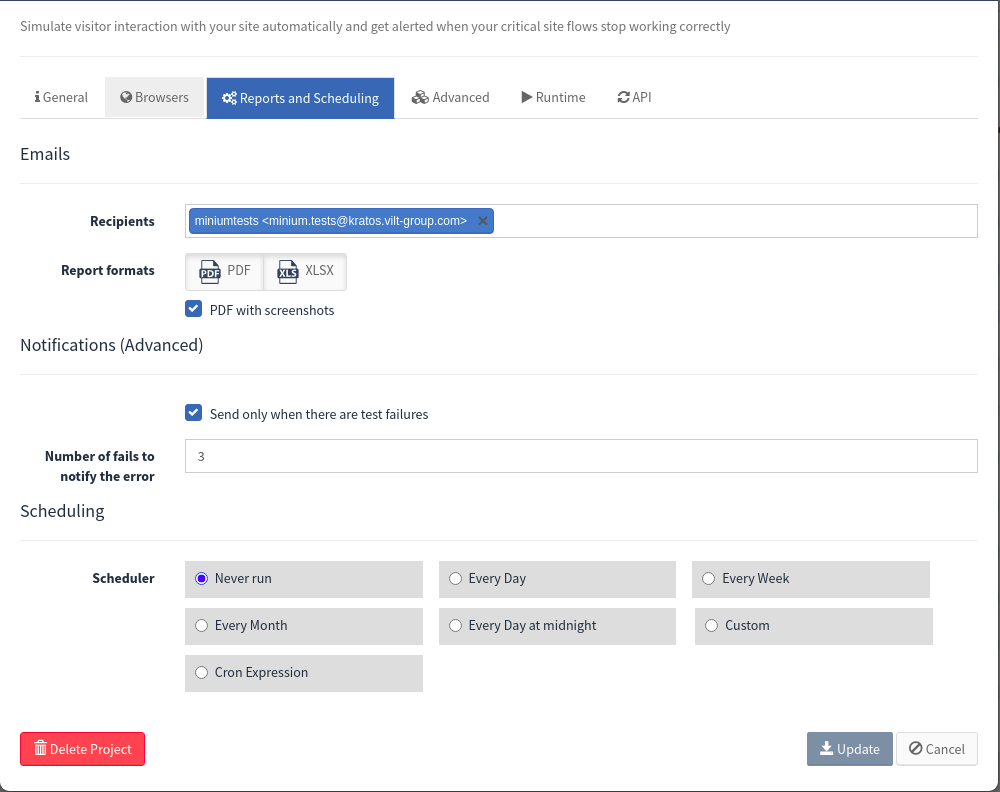
On the Reports and Scheduling tab, fill the following fields:
Recipients |
Set email addresses to receive a report of execution for the project. You can search by the username or email in the list of users registered in the system (or present in ldap). You can also add emails that are not on the list. If you want to receive the pdf report with screenshots, check the option "PDF with screenshots". |
Send only when there are test failures |
If you only want to receive the report of the executions that contains failed tests, check this option. Also, if the credentials of the SCM repository fails, the email addresses will receive a notification warn the users that the SCM credentials are invalid ou incorrect. |
Number of fails to notify the error |
Set the number of failed tests in a row to notify the user (via email and sms). |
Scheduler |
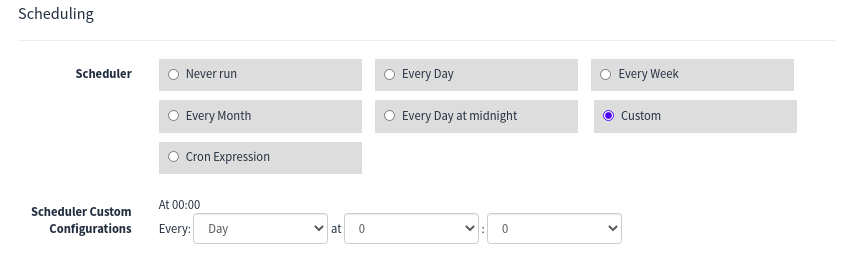
Set the schedule you want to execute the project and send the report of the execution.
If you choose the option |
Scheduler Custom Configurations |
Set the schedule you want to execute the project and send the report of the execution with different levels of granularity. |
Cron Expression |
Set the schedule you want to execute the project and send the report of the execution via a cron expression. |
Monitoring
For the monitoring project the Reports and Scheduling tab contains more configurations:
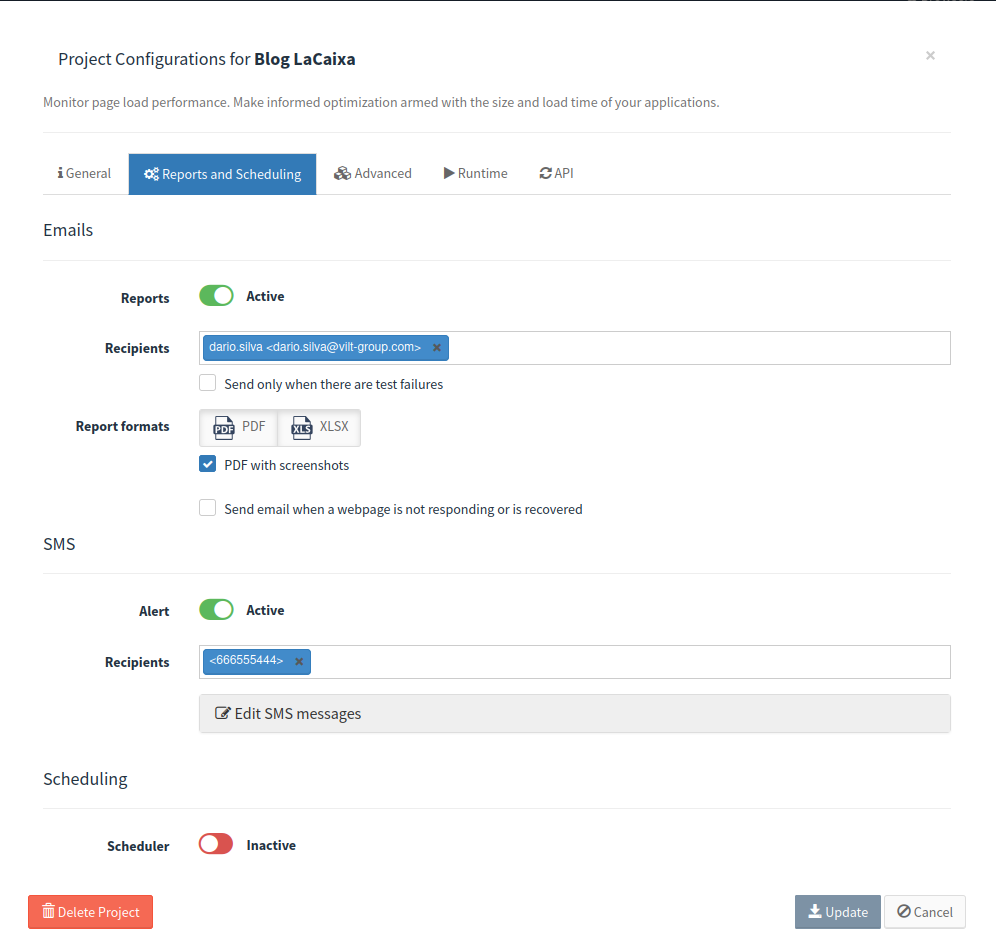
On the Reports and Scheduling tab for the monitoring projects, you can also need to fill the following fields:
Send email when a webpage is not responding or is recovered |
Send the email notification to the emails configured at the Recipients (Emails) configured to warn the user when the website is not responding, or the website recovers (from a failure). |
Recipients (SMS) |
Set mobile phone numbers to receive an SMS when the project. You can search by the username or phone number in the list of users registered in the system (or present in ldap). You can also add phone numbers that are not on the list. |
Edit SMS Messages |
Set the messages that the users will receive on failure and on recovery. |
Cookie Crawler
For the monitoring project the Reports and Scheduling tab contains more configurations:
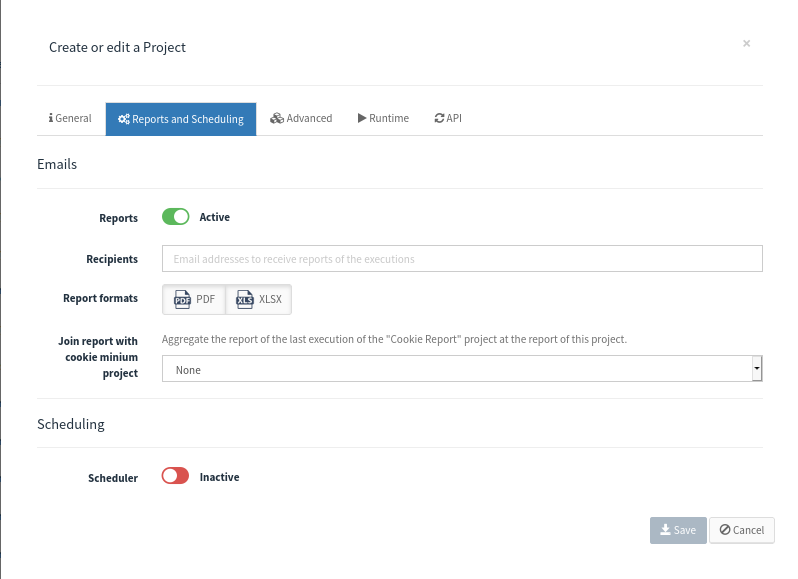
On the Reports and Scheduling tab for the Cookie Crawler projects, you can also need to fill the following fields:
Join report with cookie minium project |
Set the Cookie Report project to the Cookie Crawler project to join the cookie report in a single project. The report generated will contain the result of the last execution of the Cookie Crawler project, and the result of the last execution of the Cookie Report project. |
2.3.4. Advanced
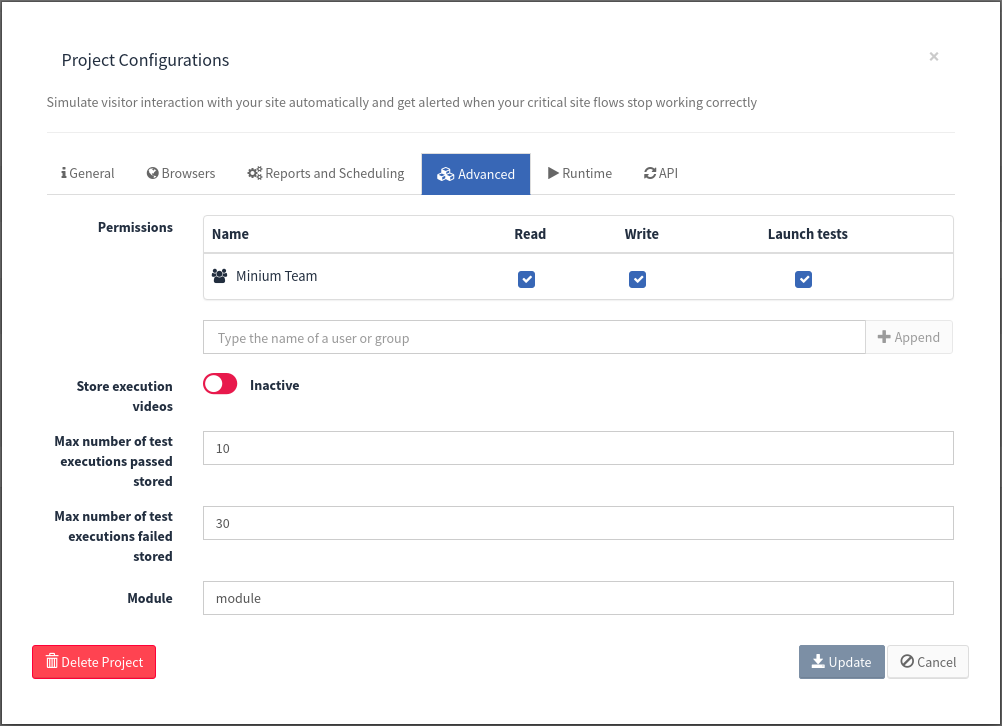
On the Advanced tab, fill the following fields:
Permissions |
Add and personalize the level of access that assigns to each user or group. |
Store executions videos |
Configuration to allow the storage of videos of the executions. When inactive, no videos will be stored, otherwise the videos will be stored. By default, the storage of videos is inactive. |
Max number of test executions passed stored |
Set the max number of executions passed to be stored at Minium Manager. The default value is 30. |
Max number of test executions failed stored |
Set the max number of executions failed to be stored at Minium Manager. The default value is 30. |
URL Loading time threshold |
Maximum time to load a page (in seconds) to warning the user at the executions page. Available only to Monitoring projects |
Module |
The path to the folder where the features are in the repository (e.g. minium-developer-e2e-tests). |
2.3.5. Runtime
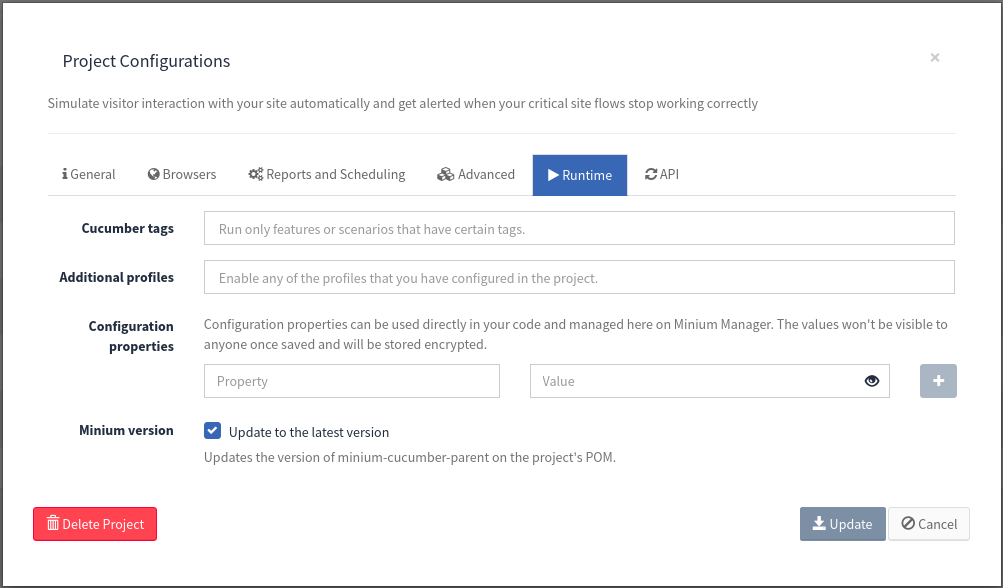
At the Runtime tab, fill the following fields:
Cucumber tags |
Use this option to tell Minium Manager that only run features or scenarios that have certain tags. |
Additional Profiles |
Enable any of the profiles that are configured in the |
Configuration properties |
This configuration properties can be used directly in your code and managed here on Minium Manager. The values won’t be visible to anyone once saved and will be stored encrypted. |
Cookie Crawler
For the Cookie Crawler project the Runtime tab is different:
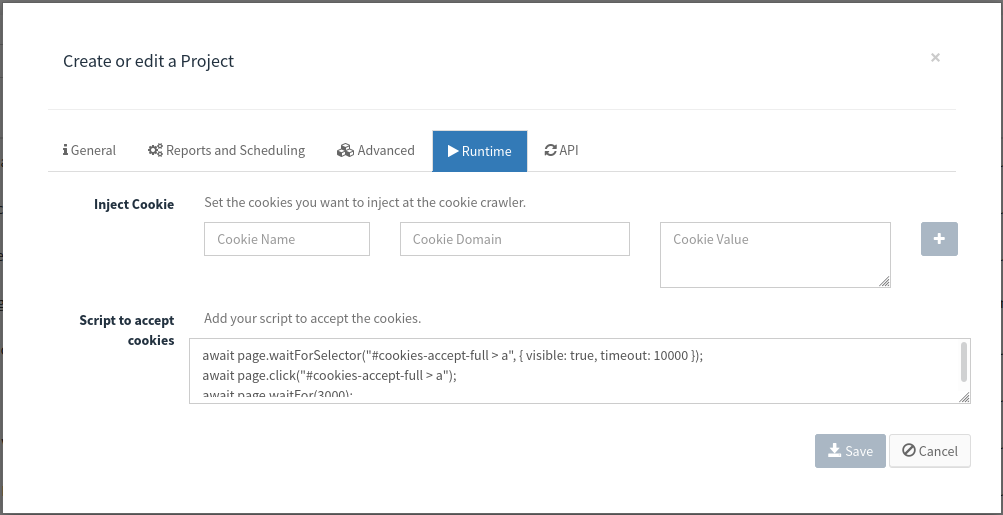
Inject Cookie |
The cookies you want to inject at the crawl (e.g. cookie to accept the cookie warning) |
Script to accept cookies |
The script to accept the cookie warning (in puppeteer). This field is related to the field |
2.3.6. API
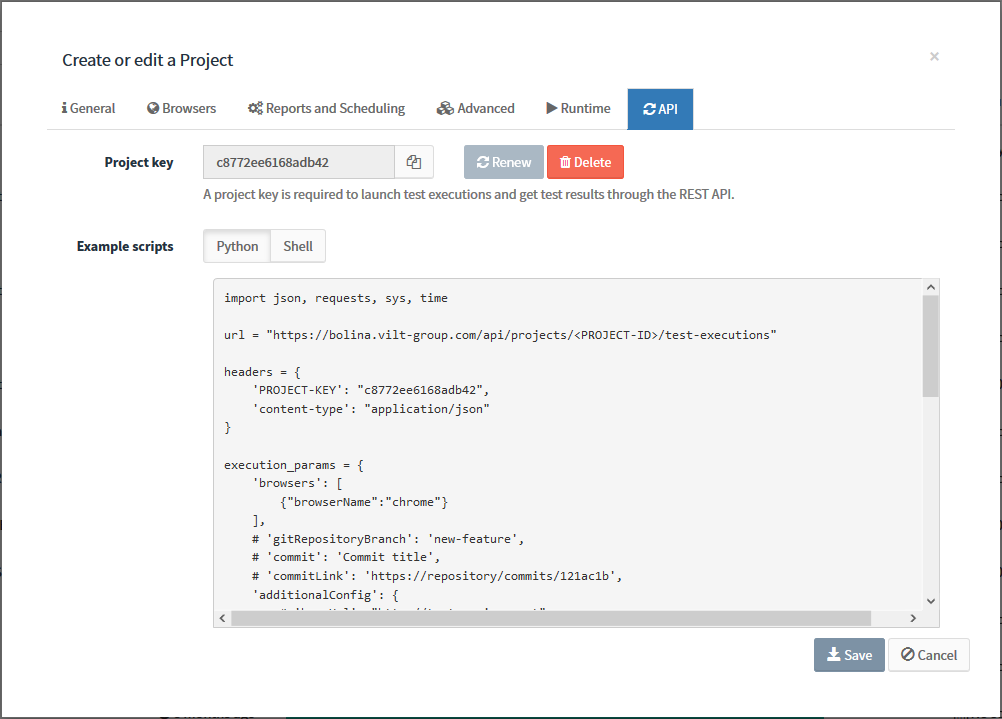
On the API tab, fill the following fields:
Project key |
Generate a project key (required to launch test executions and get test results through the REST API). |
Example scripts |
Once the project has an API key, the scripts will be fulfilled with the project-specific data and ready to use. The first part of the script shows how to launch a test execution. |
2.4. Project permissions
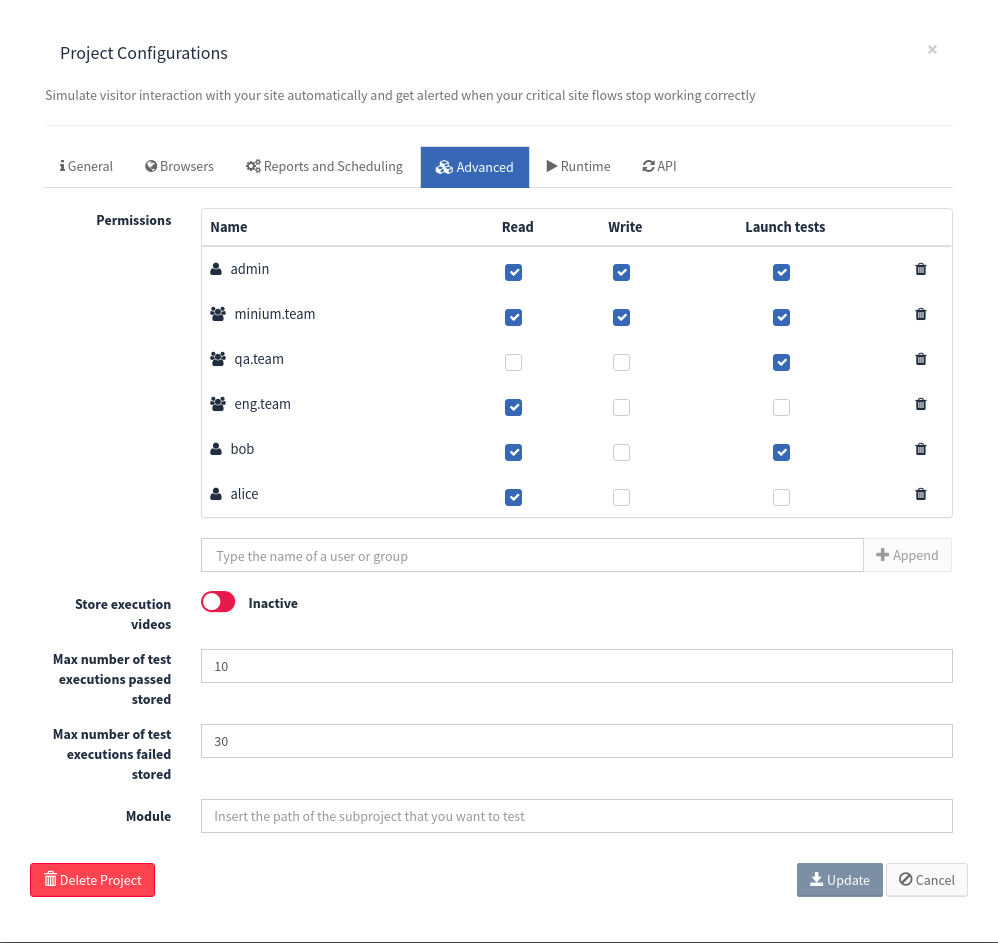
Manage the access levels of the users/groups in the projects. It is also possible to add and personalize the level of access that assigns to each user or group, per-project.
|
Note:
Write permissions is required to update the permissions of a project. |
In order to change the project permission the first step is go to the project configuration and click on tab Permissions.
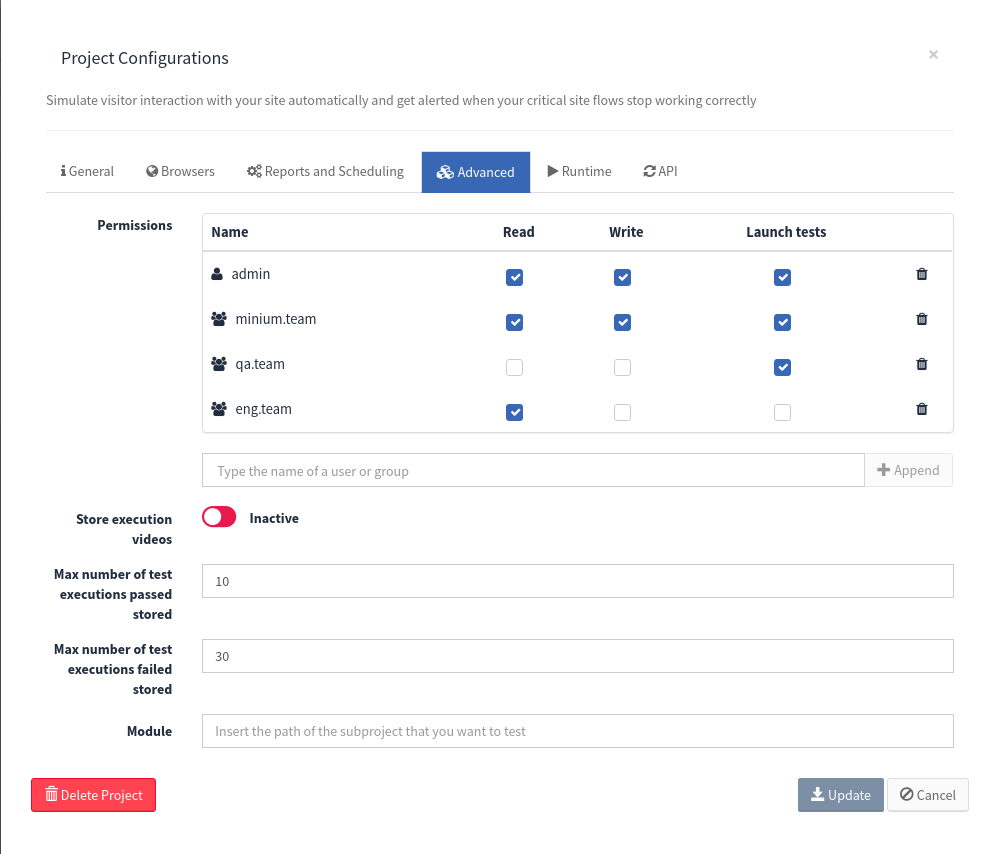
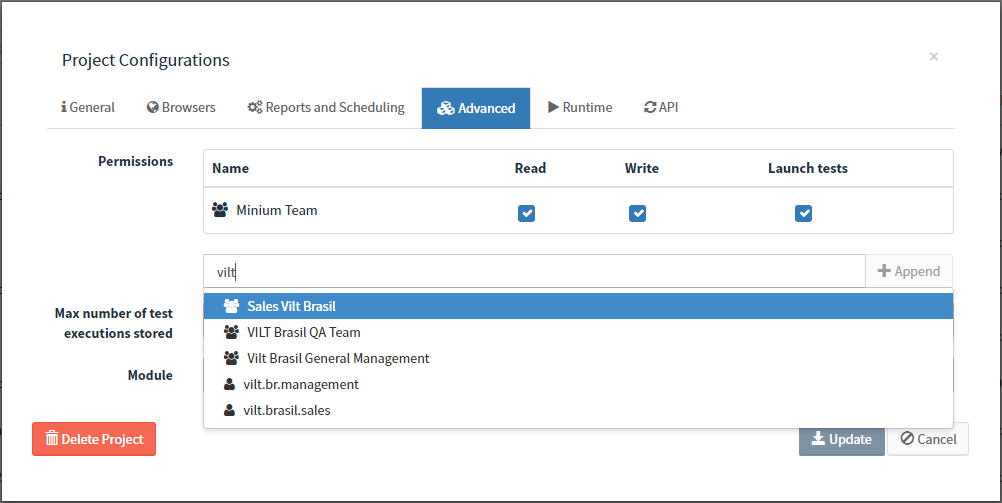
Add user or groups to the permission table. Below the permission table, start typing the name of the user or group desired. Then click on the button Append.
|
Note:
It is possible to select more than one user or group. |

After the users or groups was appended to the permissions table, define the permission for each entry appended and click Update to save the project configurations.
2.5. Organise projects by Labels or Groups
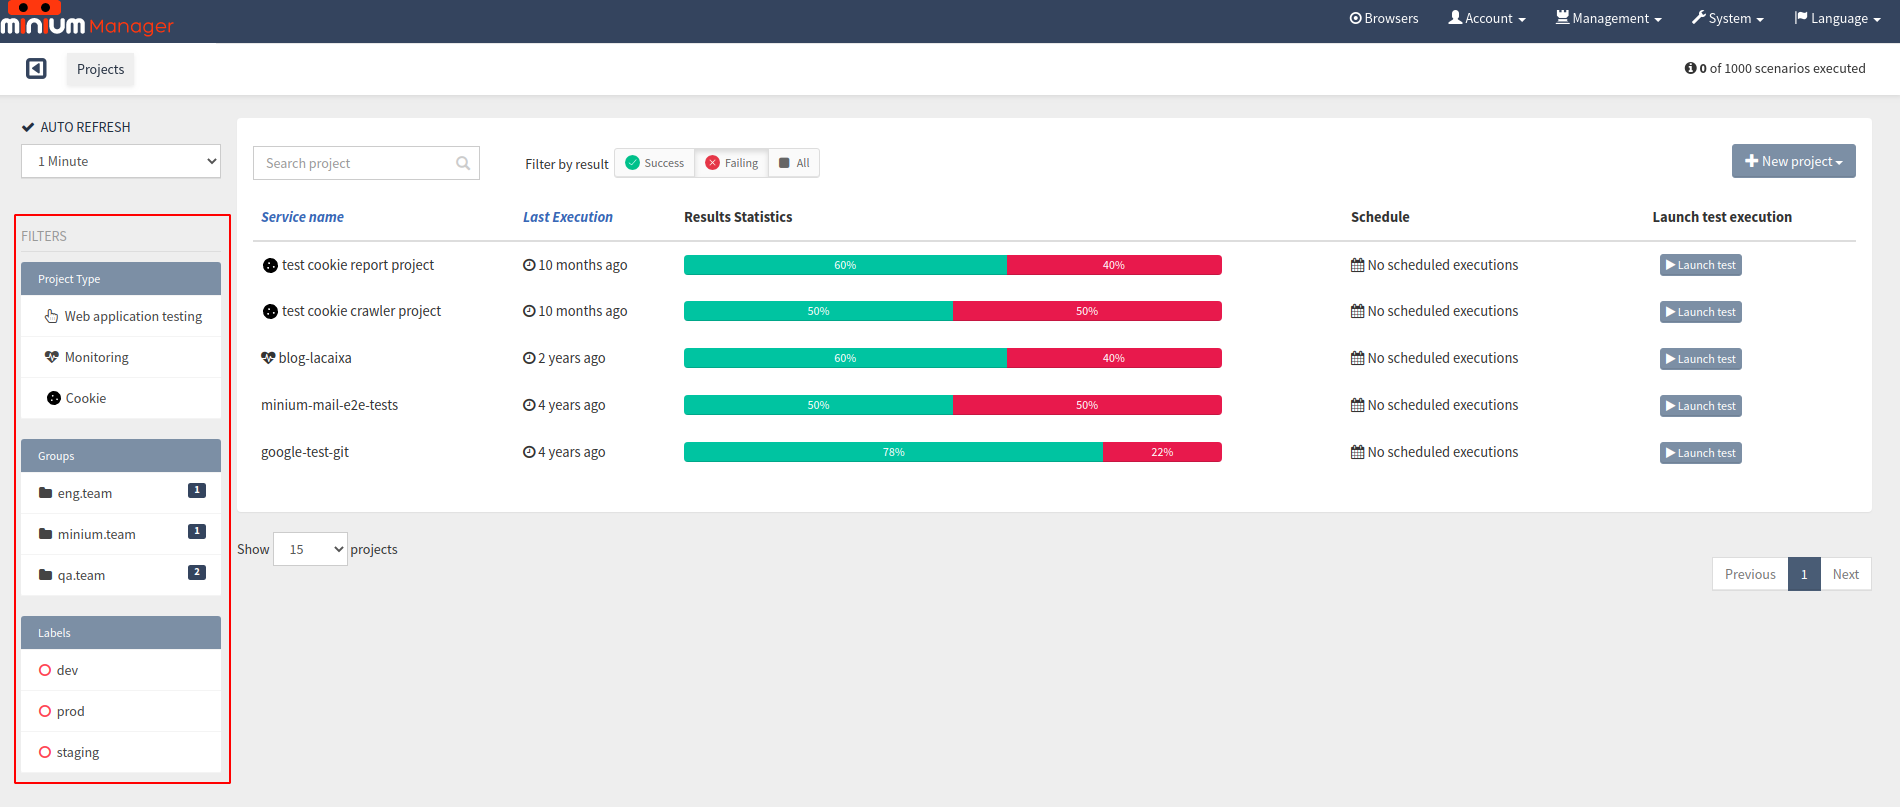
Labels were meant to be used only to filter projects in the Projects page providing a useful way to organize the projects.
2.5.1. Manage Labels
To manage the labels, open the Management menu and click on Labels:
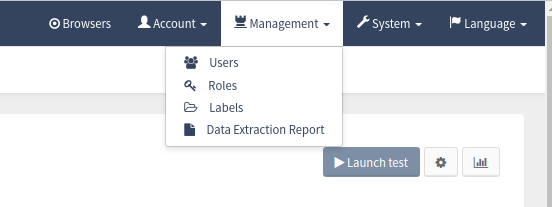
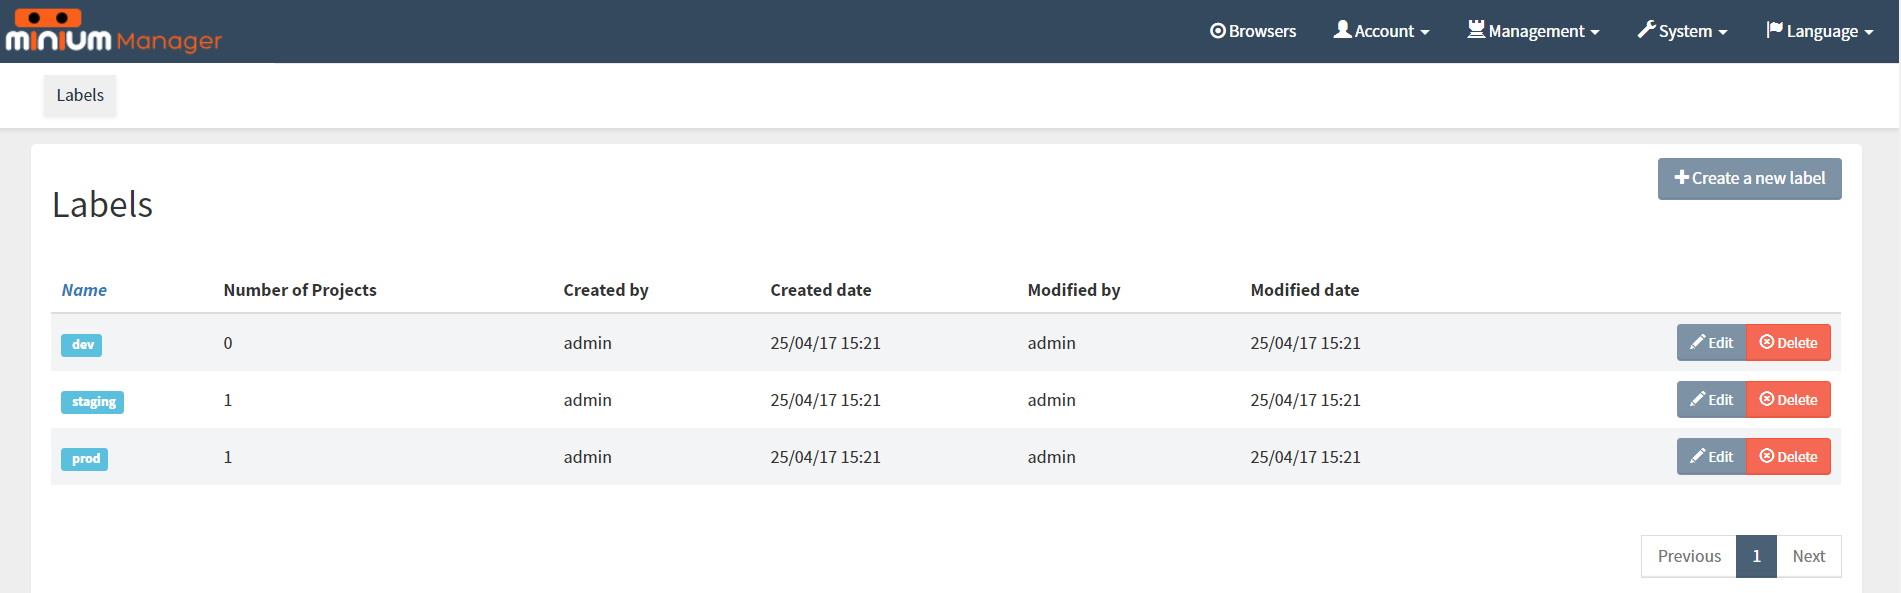
The Labels page is shown with all current labels. Edit, delete and create new ones if desired.
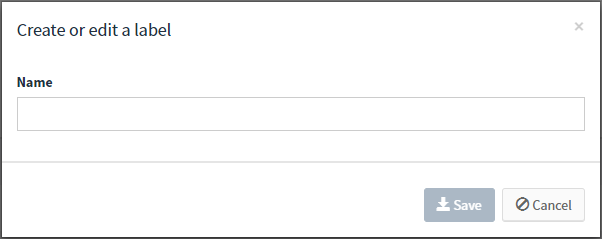
To create a new label, click on Create a new label.
To delete or edit an existing label, click on Edit or Delete respectively.
2.5.2. Assign labels to the projects
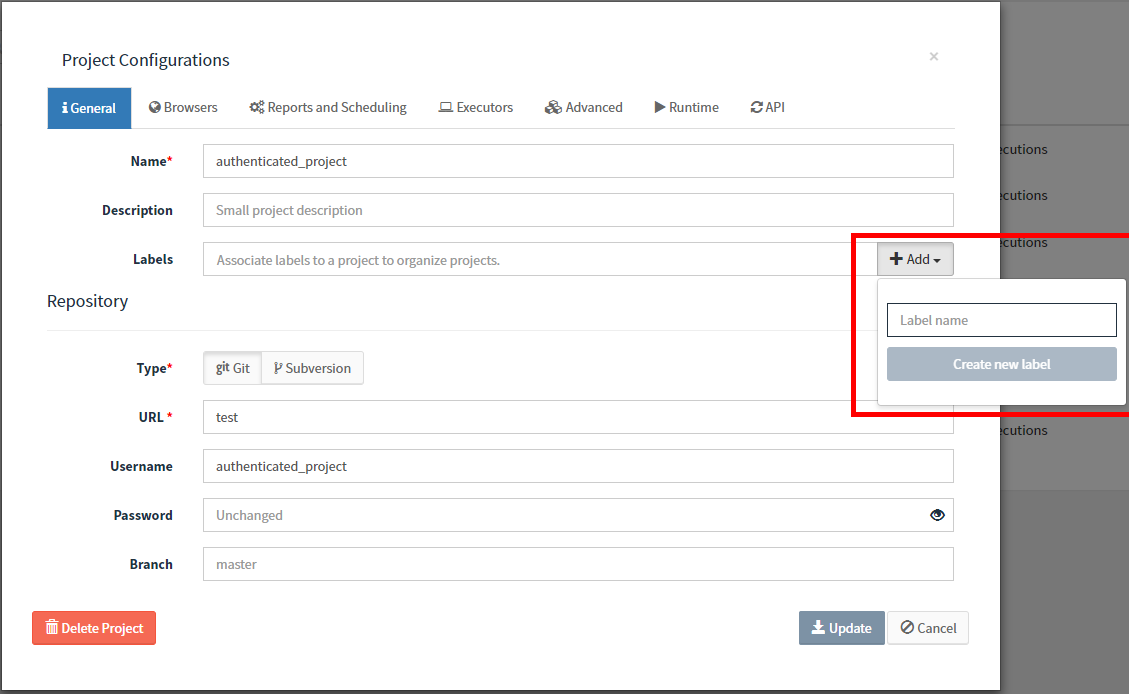
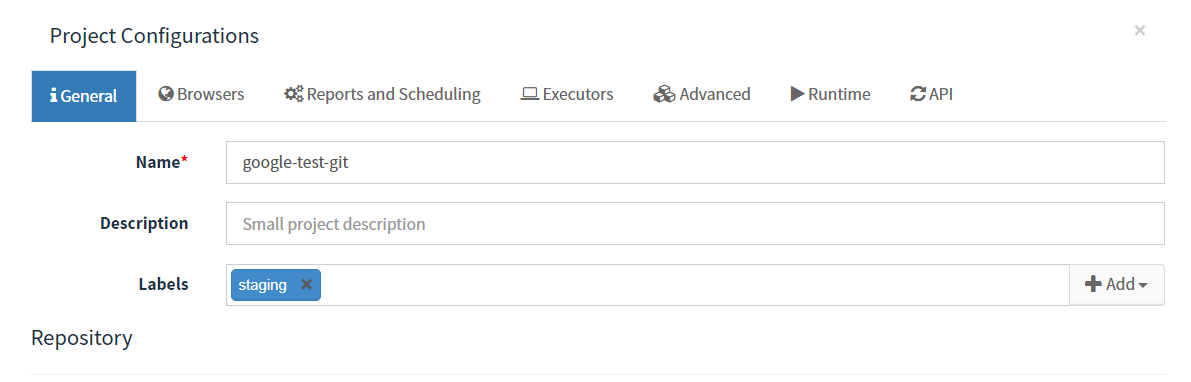
To assign some labels to a project, go to the project configurations:
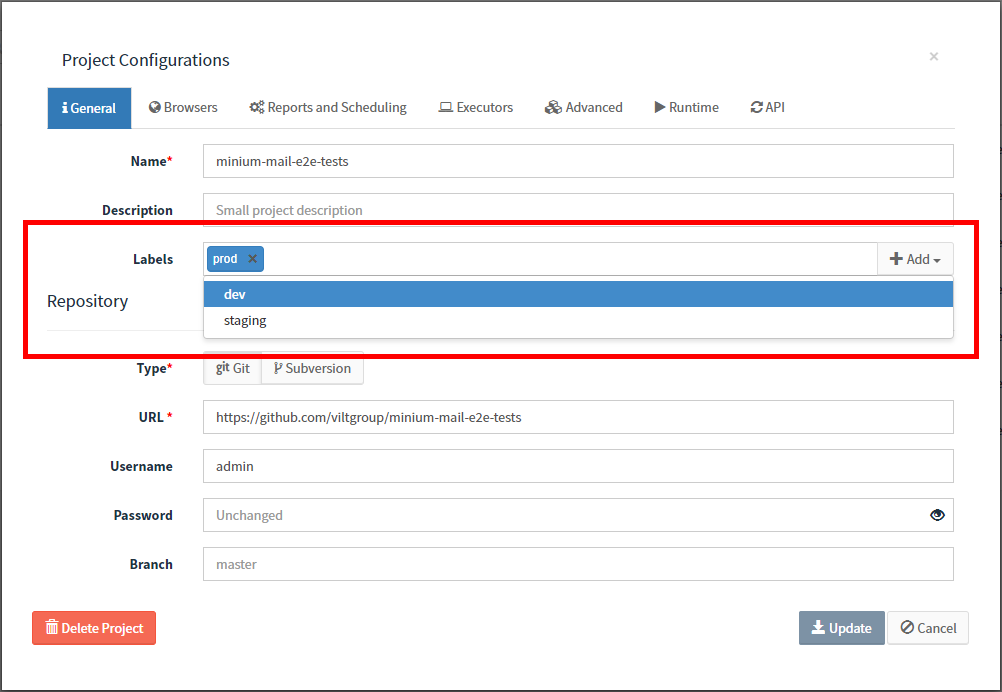
The Add button can be used to create new labels if needed.
2.5.3. Manage groups
Groups are intended to organize projects at a higher level and to perform changes in several projects at a time.
Manage groups using LDAP authentication
If Minium Manager is using LDAP to manage the users, the groups are configured through the LDAP.
In the project configuration, search for groups. Below the permission table, start typing the name of the user or group. This will perform a search into the LDAP directory.
Manage groups without LDAP authentication
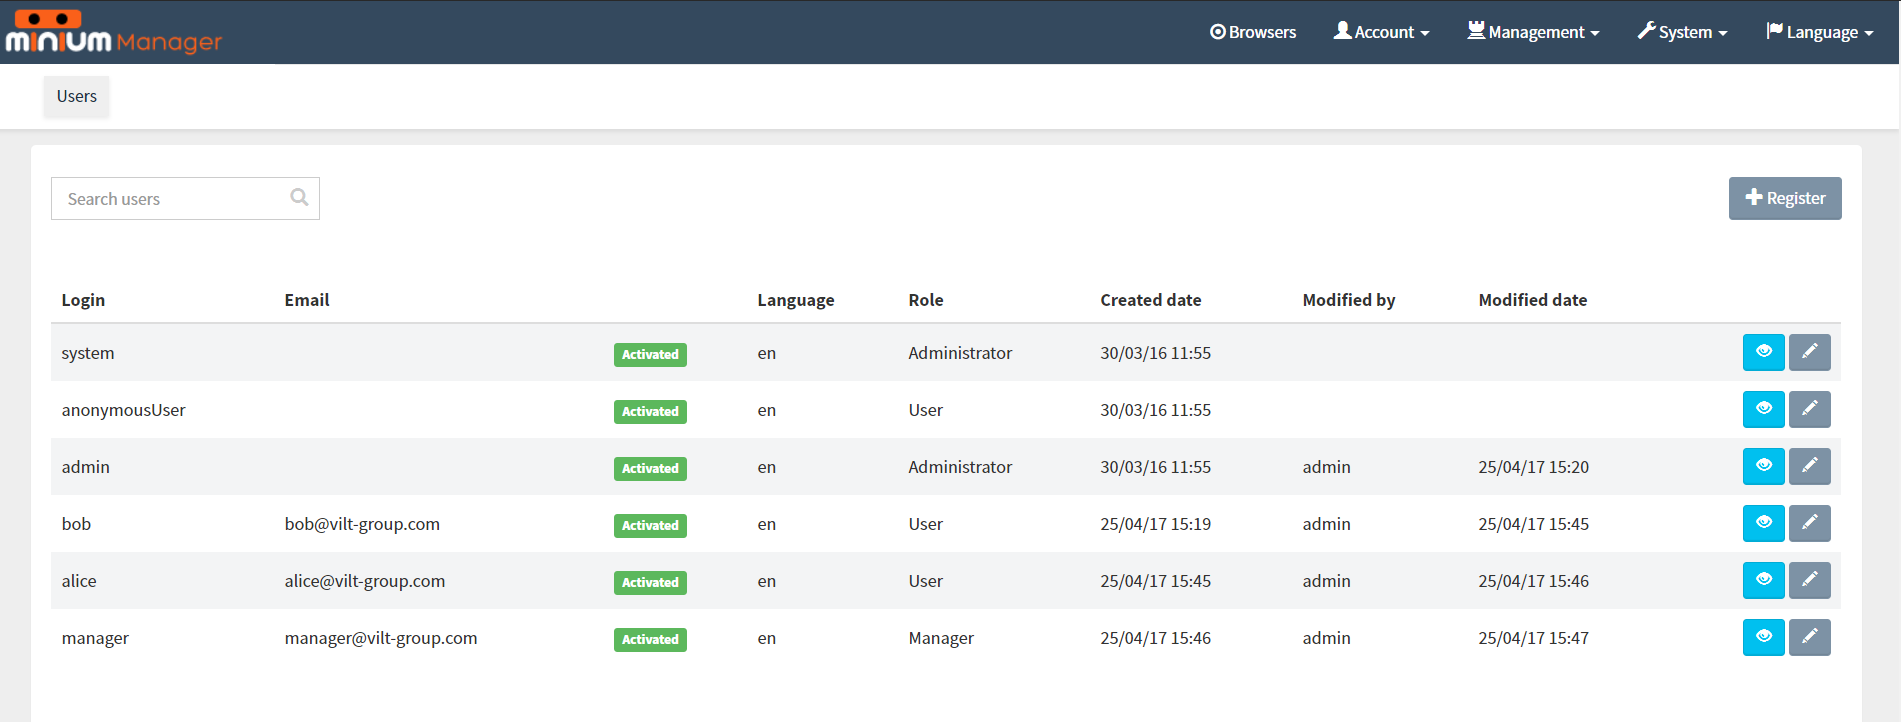
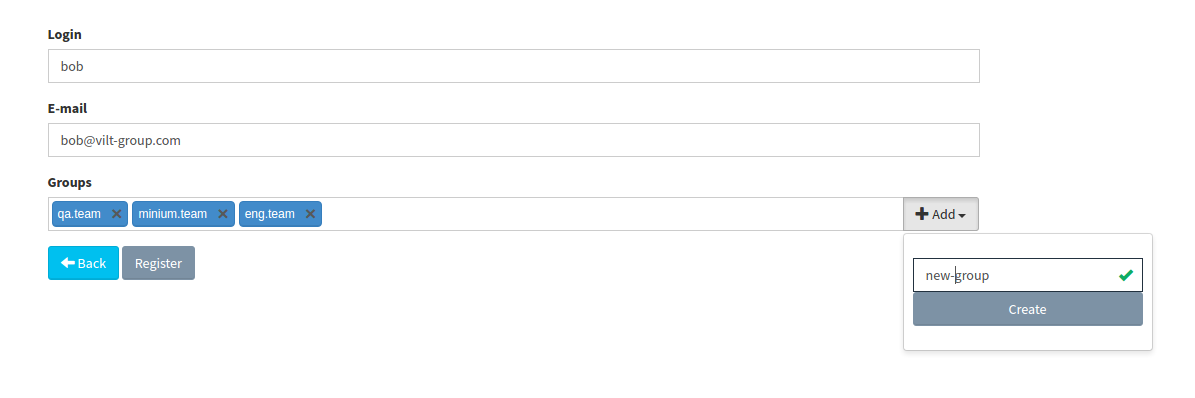
If Minium Manager is not using LDAP authentication, create new groups through the user management UI.
|
Note:
Only the users with Admin privileges are allowed to create groups.
|
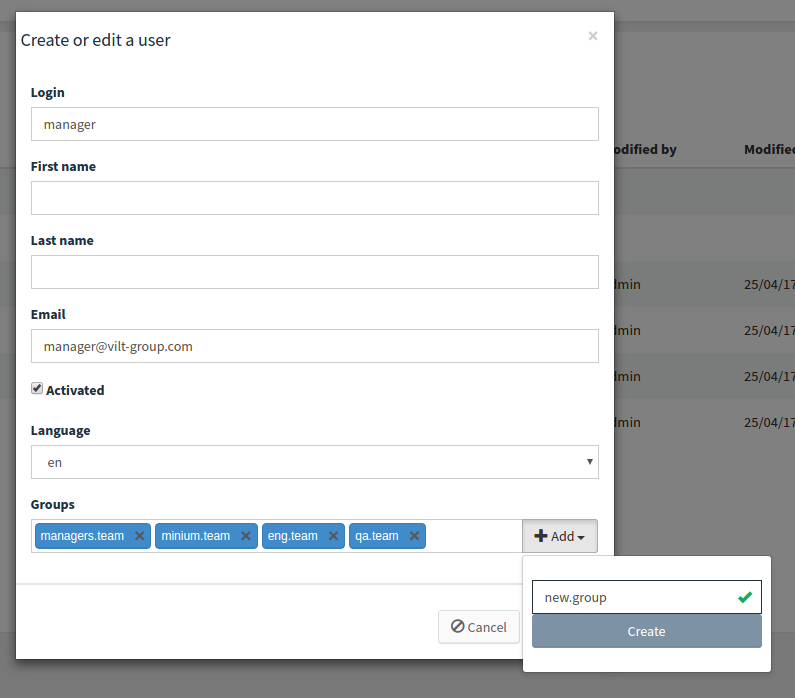
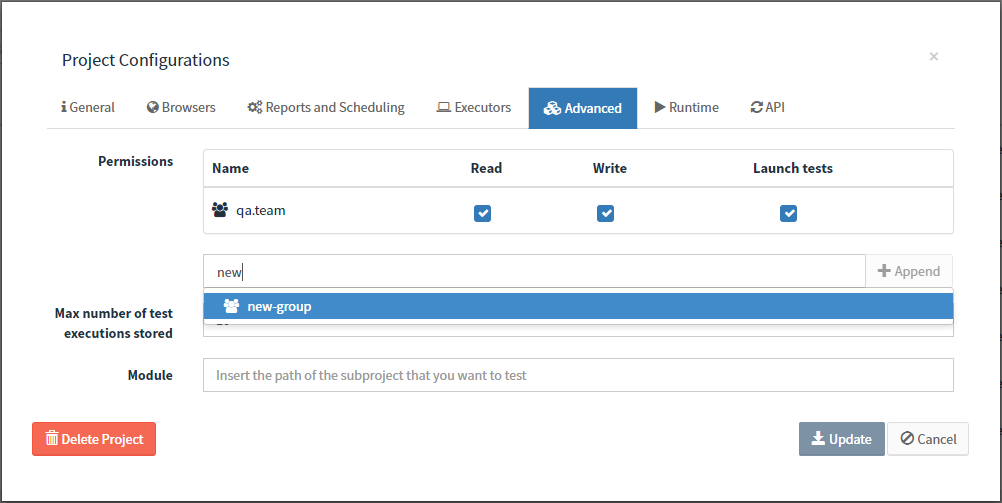
If desired, add permissions to the group recently created in the project configuration. Below the permission table, start typing the name of the group created.
2.5.4. Organise Projects
Using groups and labels to organise the projects selecting a group and labels from the sidebar.
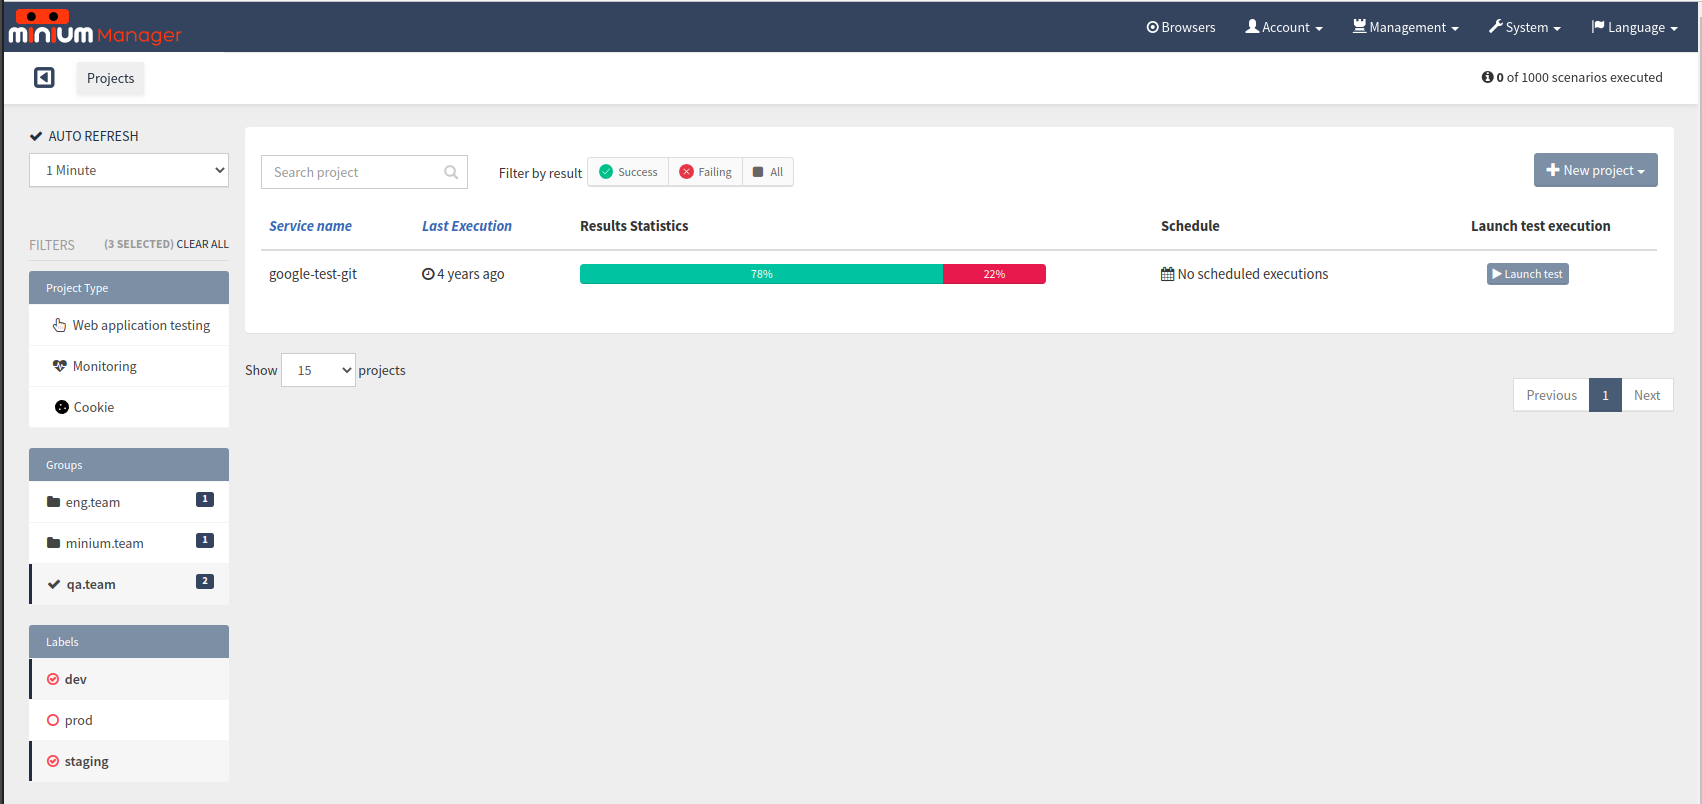
Select one group at a time, but select multiple labels and combine both.
In the case of the figure above, notice that the group qa.team is selected and two labels are also selected (dev and staging). With filters applied, exists one project shown in the project list.
This means that the one project belong to the group qa.team (see it in the figure below).
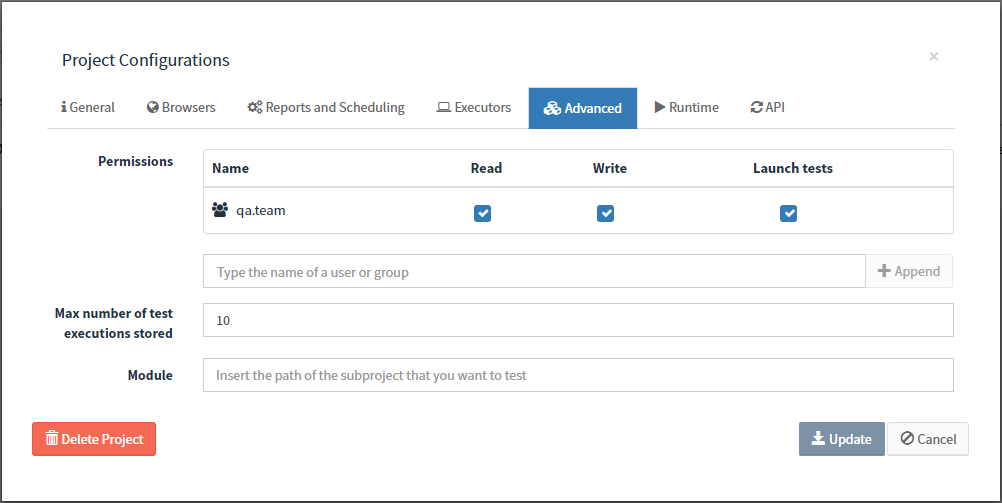
The project either has the label dev or staging associated with it in the project configuration (as shown in the figure below).
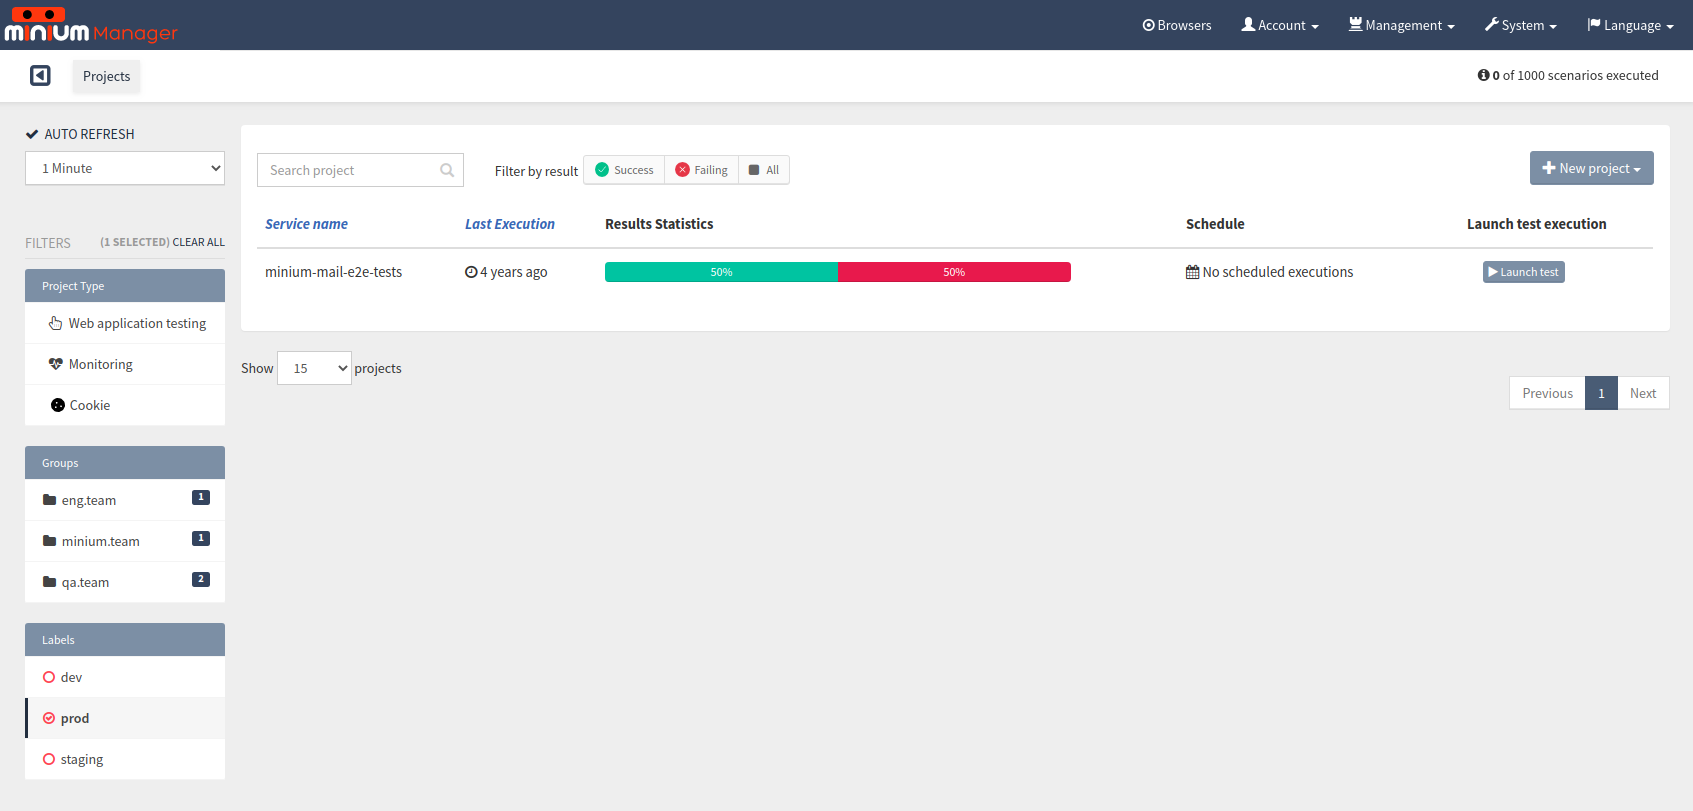
Select a group or one or more label, like shown in the figure below. In this specific case, are selected only the label prod, without selecting any group. It means that all the projects in the list have the label prod associated.
Clean project filters
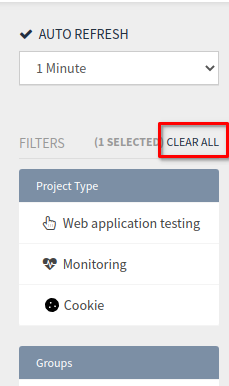
By clicking on the link CLEAR ALL, it will remove all the selected filter.
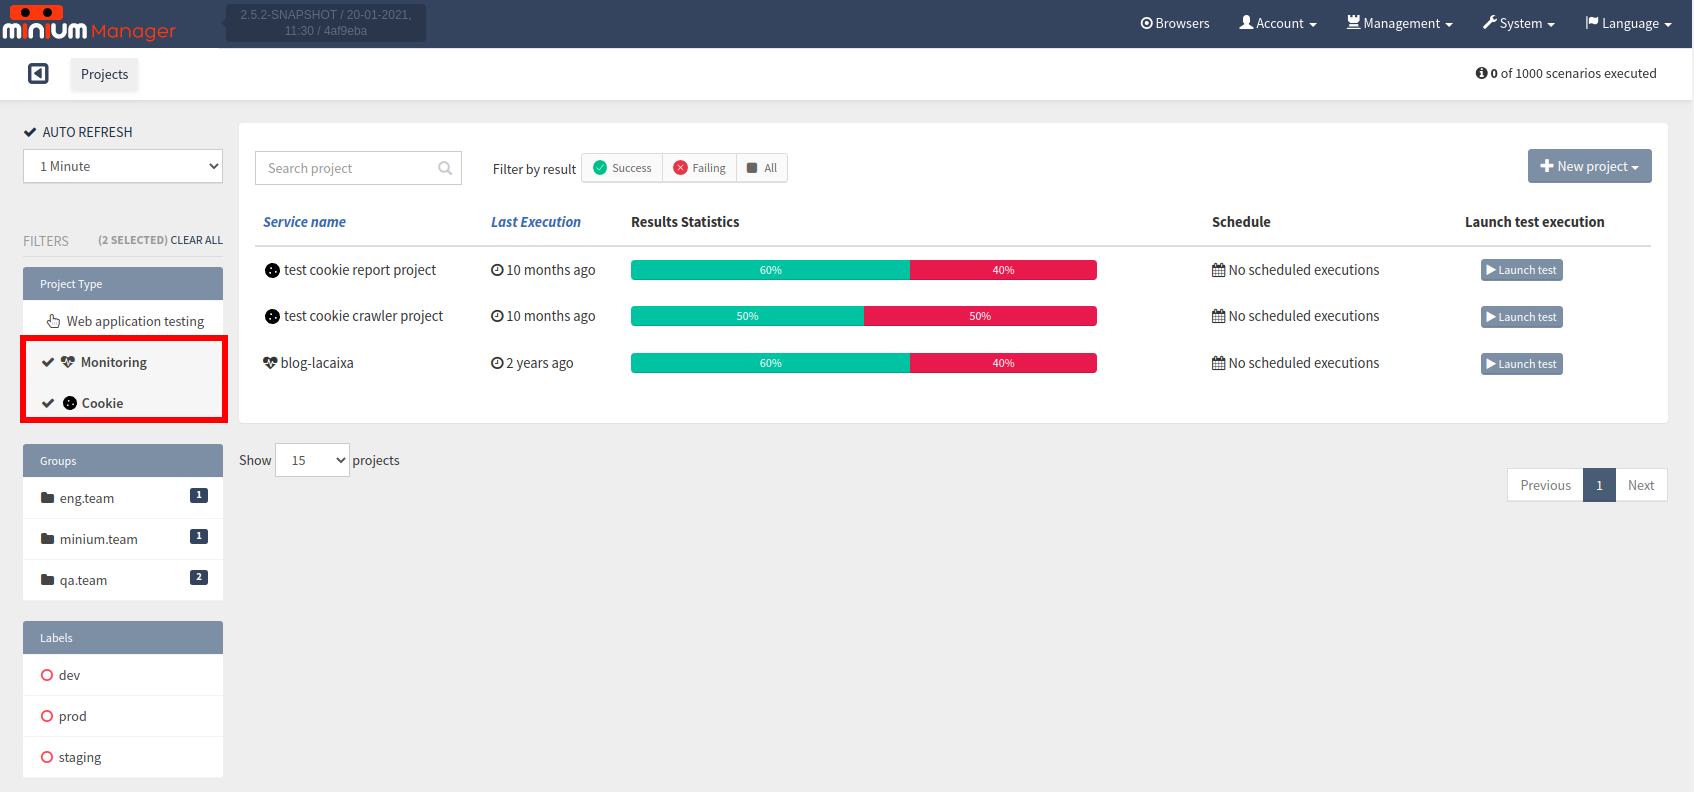
Project Type
We can filter the projects by its type. Select the project type(s) to filter the project list:
Auto Refresh
By default, the project page will be refreshed every minute. Also, you can configure the project page to refresh every 5 and 10 minutes.
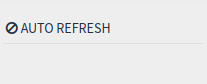
To disable the auto refresh, just click on the link "AUTO REFRESH":
|
Note:
The link "AUTO REFRESH" with the ban icon, means that is disabled; The link "AUTO REFRESH" with the check icon, means that is enabled. |
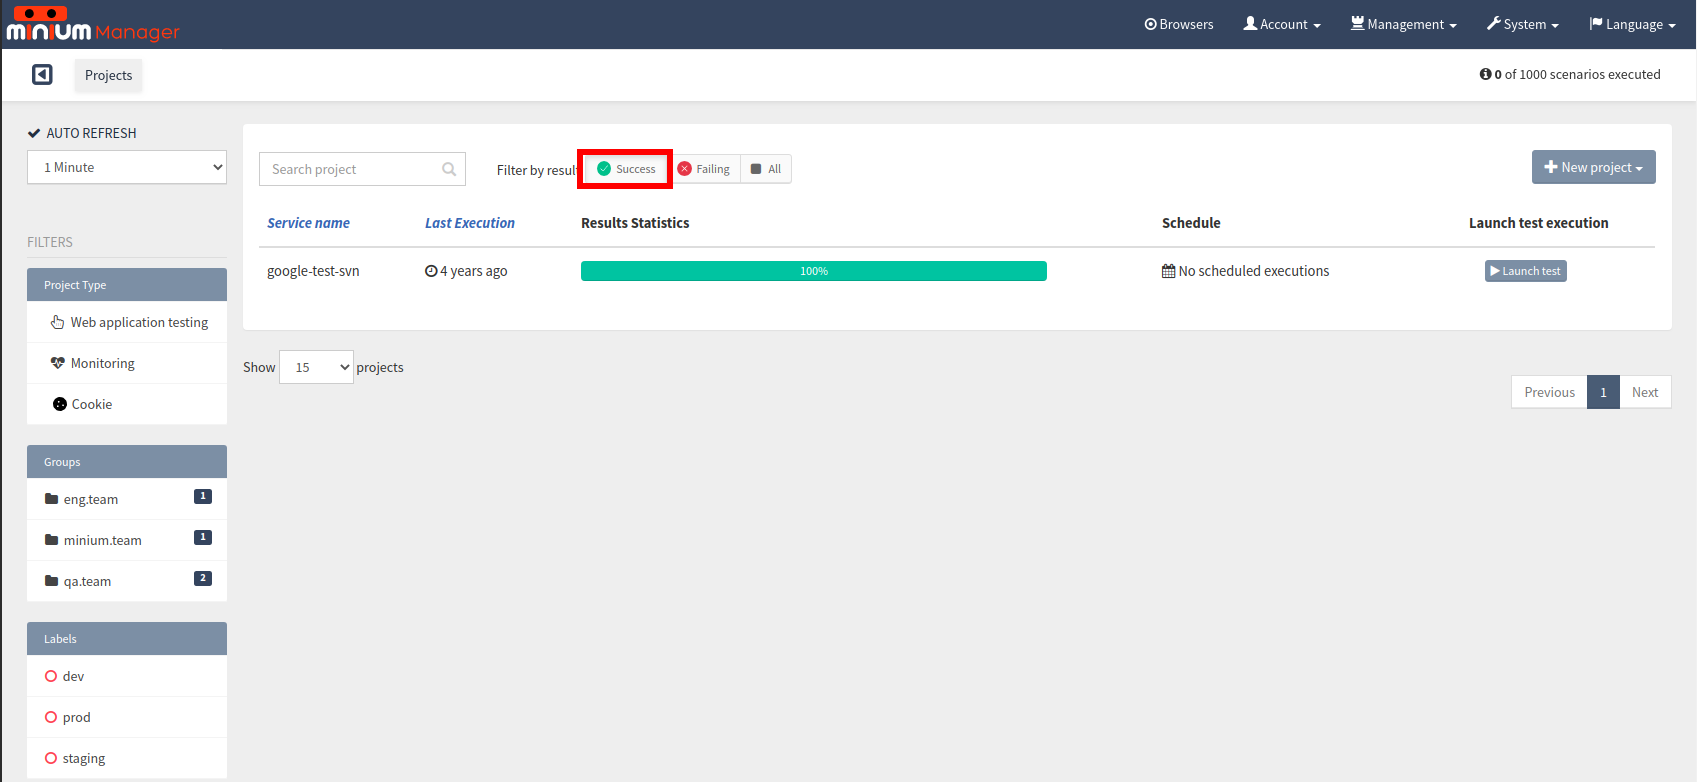
Filter by Results
Select the result status to filter the projects in the projects list:
2.6. Configuration profiles
Configuration profiles can be defined on the config/application.yml of a project and used to load configuration properties that vary based on the environment being tested. Such a configuration could be for example the URL of the application or the language:
# default values
minium:
  config:
    baseUrl: http://localhost
    language: English
---
spring.profiles: qa
minium:
  config:
    baseUrl: http://staging
---
spring.profiles: es
minium:
  config:
    language: Spanish
These configuration properties can then be used on the step definitions like this:
When(/^I go to the homepage"$/, function() {
  browser.get(config.baseUrl);
  $(".dropdown").withText("Language").click();
  $(".dropdown a").withText(config.language).click();
});
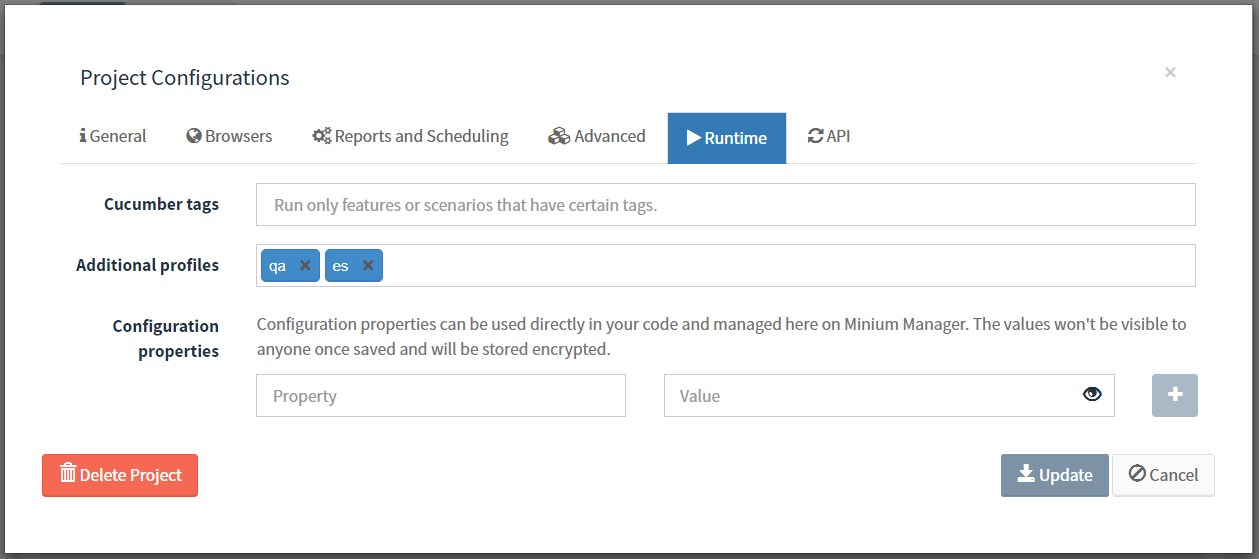
Then to run test executions with the configuration properties of a profile, go to Project Configurations and add it to Additional profiles:
2.7. Secret configuration properties
Sensitive configuration properties that cannot be included on the repository of the tests can be safely stored on Minium Manager. They can be used just like the configuration properties defined on the config/application.yml file of the project. As an example, consider that some tests need to be executed against a production environment which requires a password that cannot be exposed on the code. In that case, only the password to be used on the test environment would be defined on the config/application.yml file:
minium:
  config:
    baseUrl: http://staging
    username: test
    password: minium

---
spring.profiles: prod

minium:
  config:
    baseUrl: https://production
    username: admin
Which would be accessible through the config.password during the tests:
When(/^I login"$/, function() {
  browser.get(config.baseUrl);
  $(":text").fill(config.username);
  $(":password").fill(config.password);
  $(":submit").click();
});
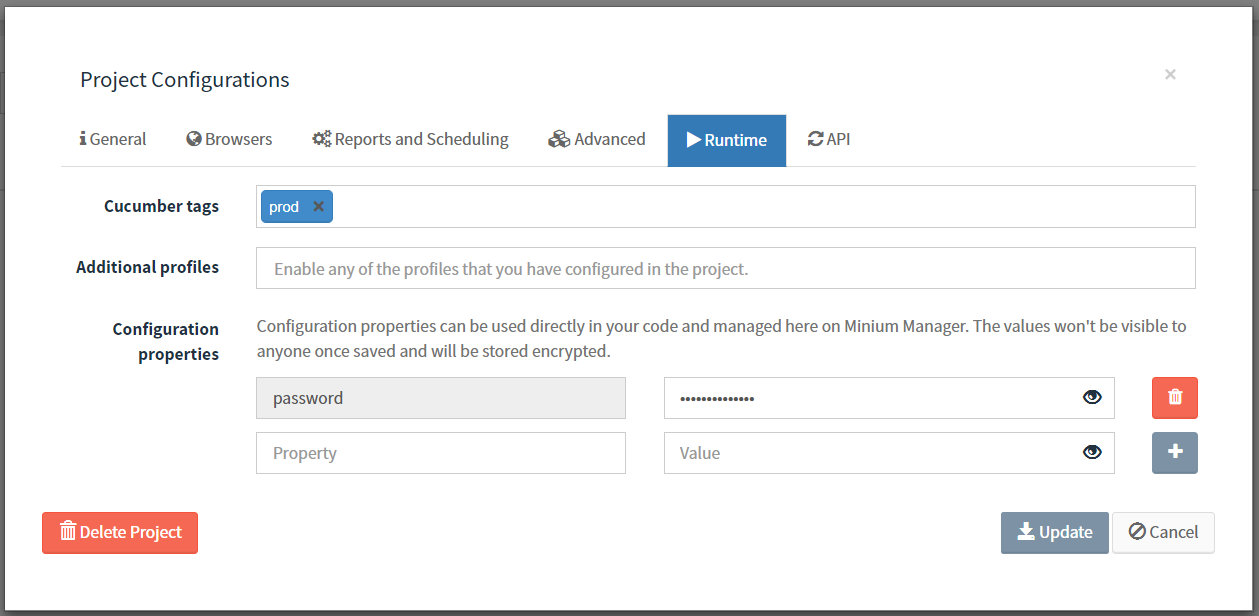
The password to be used on the production environment would then be defined on the Project Configurations:
2.8. Add test information to Minium Manager Report (output)
We can add information of the test execution to the Minium Manager report by adding a simple minium instruction to the code of the Minium Project.
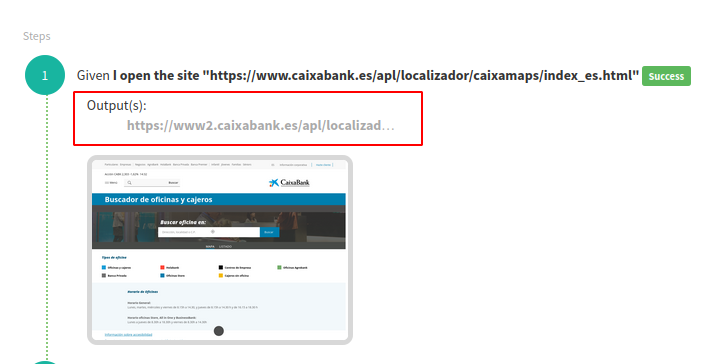
By add the minium expression scenario.write(…); we are able to pass data to the Minim Manager report. E.g.:
Given(/^I open the site "([^"]*)"$/, function(url) {
    browser.get(url);
    scenario.write(browser.getCurrentUrl());
    scenario.embed(browser.screenshot().asBytes(), "image/png");
});
The previous script will generate the following output in the Minium Manager console:
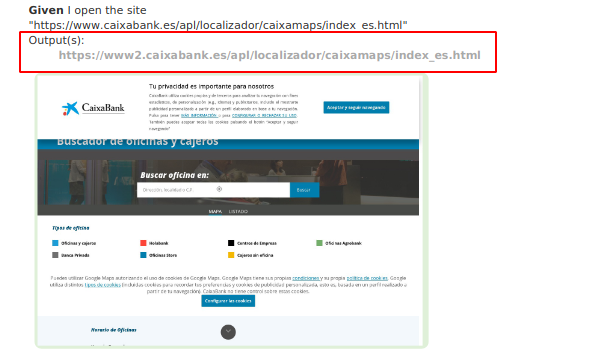
On the PDF report:
2.9. Delete a project
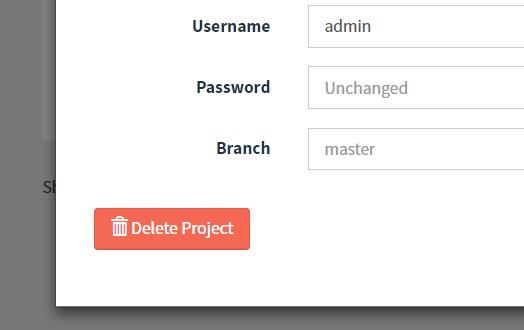
To delete a project, go to the project configurations and click on the button Delete Project, at the bottom-left corner:
2.10. Edit projects in batch
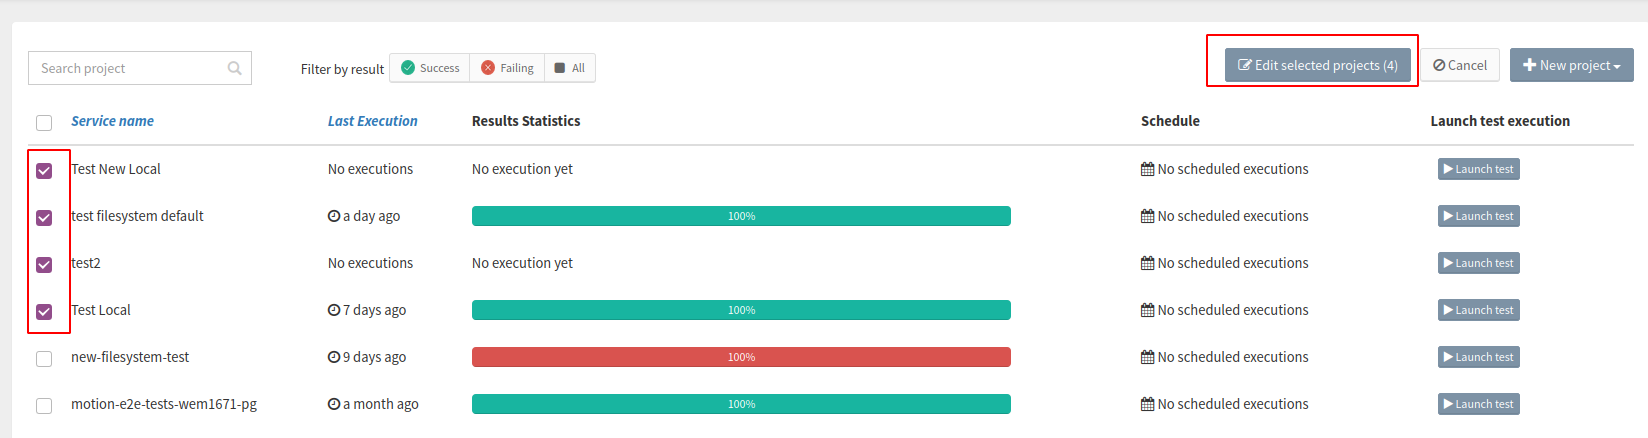
To edit projects in batch, click on the button Edit multiple projects:

After the click, select the projects you want to edit and click on the button Edit selected projects:
After, you can edit the common properties of the projects in the modal:
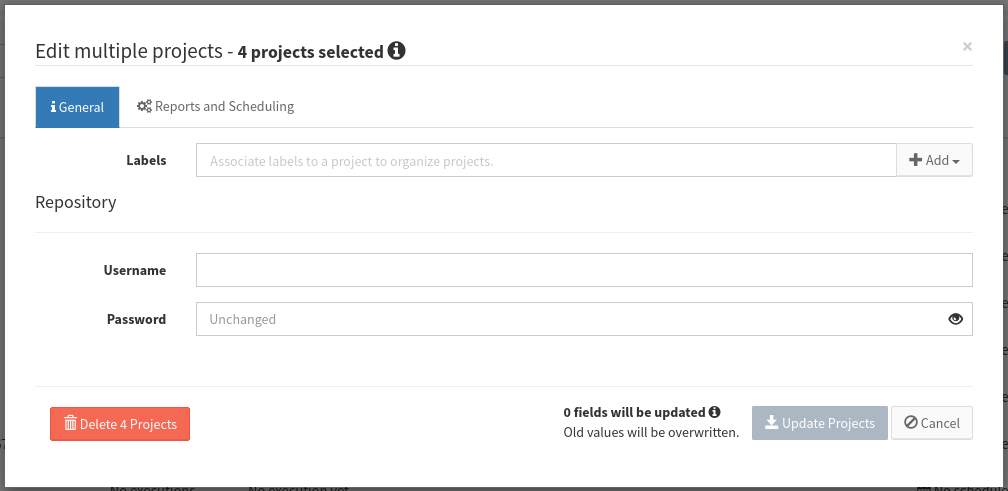
After the changes, click Update Projects to save the changes ou Cancel to return to the projects page.
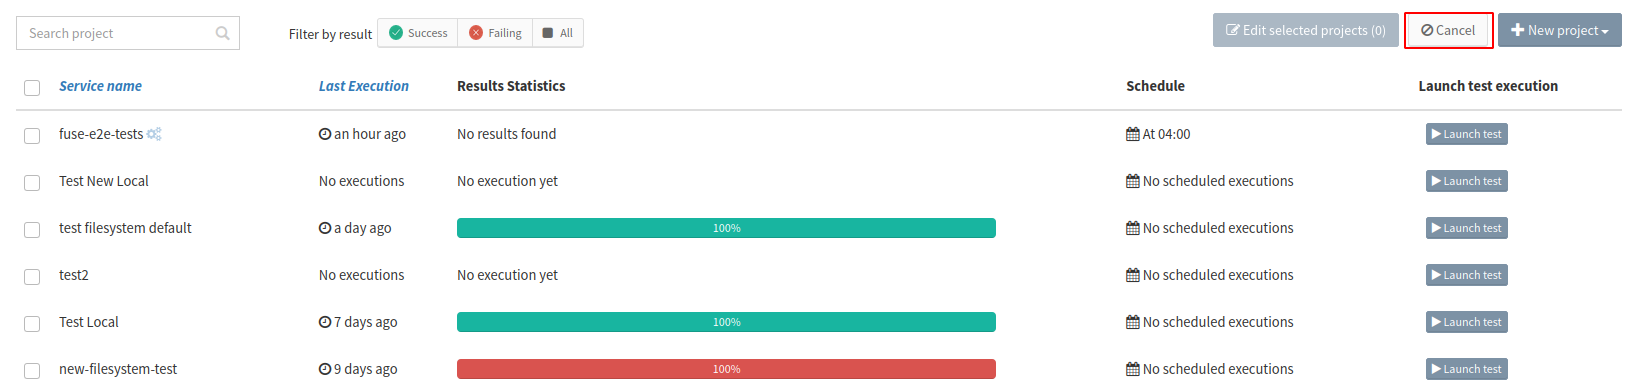
To stop the edit and deselect the projects, you can click Cancel:
2.11. View Queue
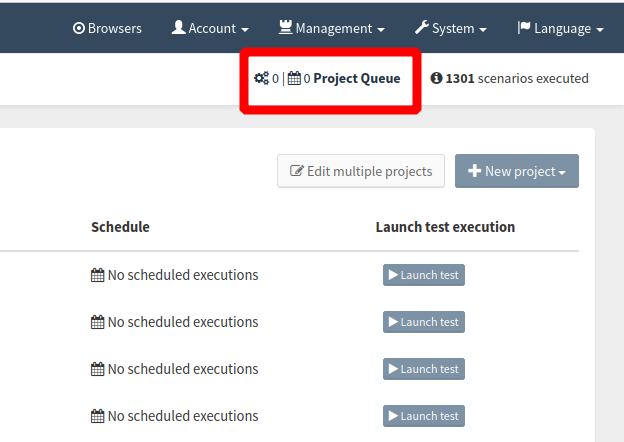
To view the current queue of executions, click on the Project Queue under the navbar:
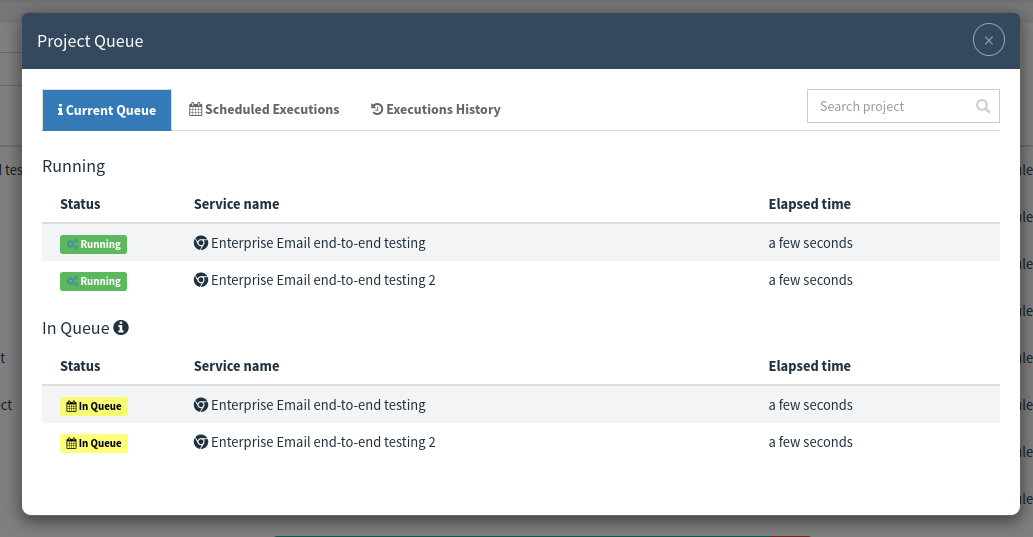
After the click, you can see the modal with the queue, with the projects Running and In Queue:
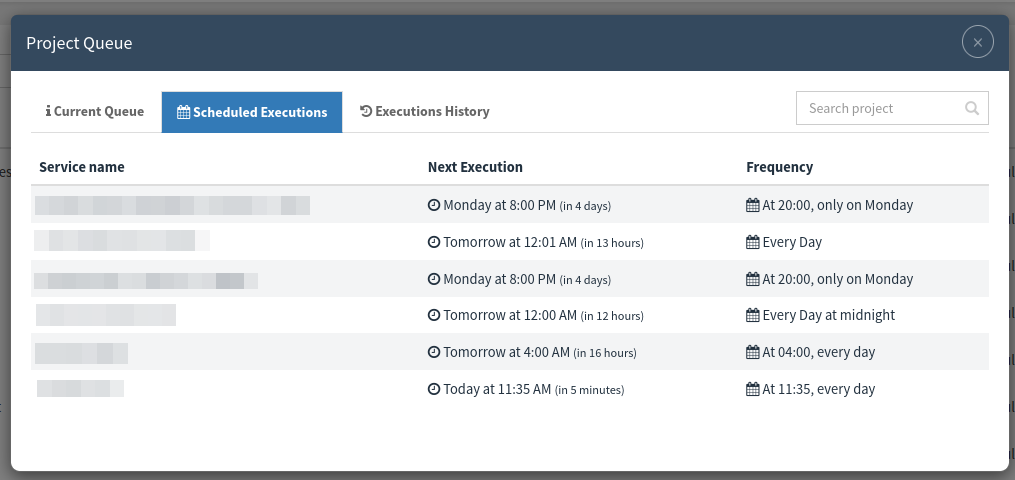
At the modal, we can also see the Scheduled Executions that will be executed in the future:
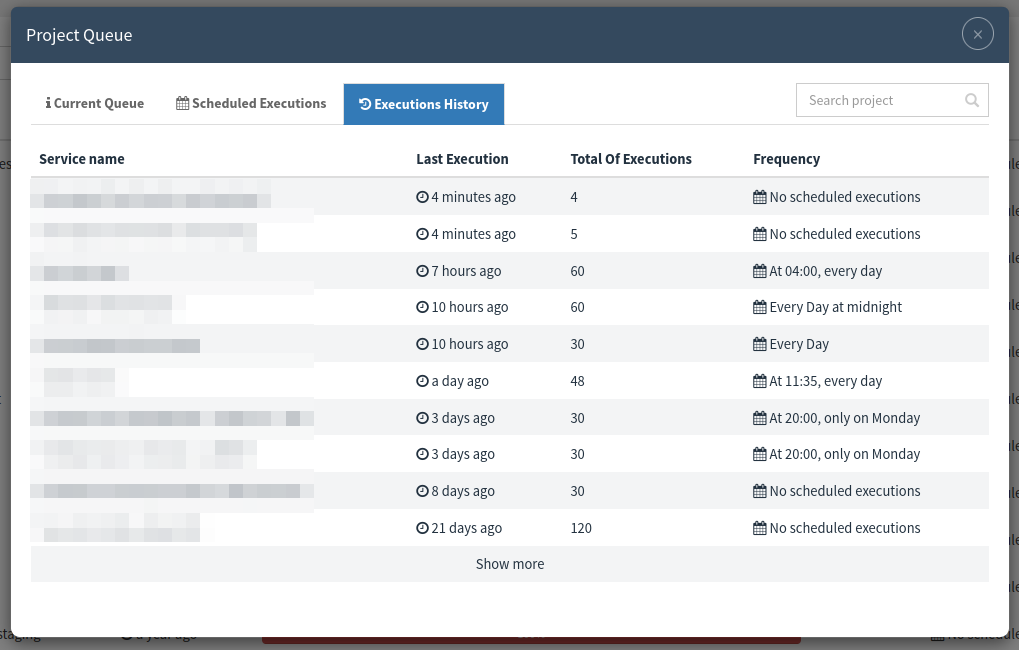
Also, the Executions History for the projects:
2.12. Edit project code (Projects in filesystem only)
If the project is configured with the repository type File System, after the upload, we can edit the code of the Minium project.
The editor can be opened through several shortcuts:
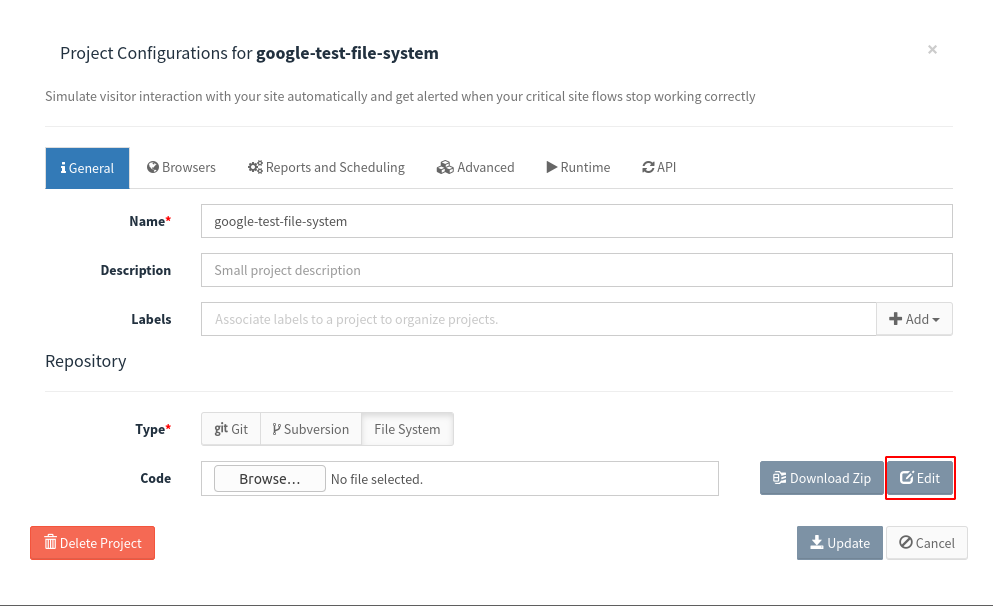
At Project Configurations by clicking at the button Edit:
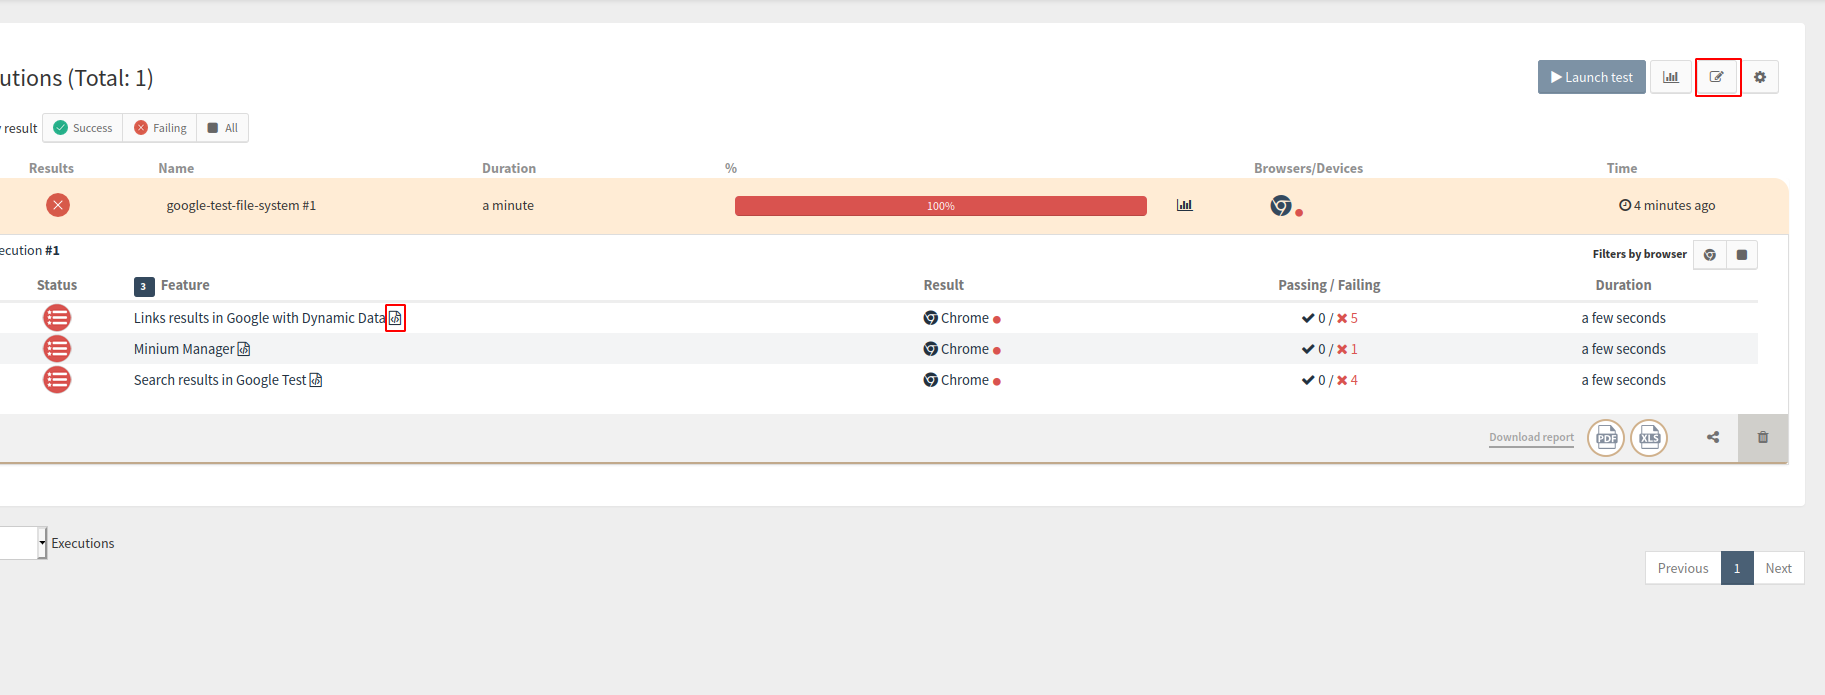
At Executions page by clicking at the button Edit, at the feature shortcuts (at web application testing project) and at the scenario and step shortcuts (at monitoring and cookie report project):
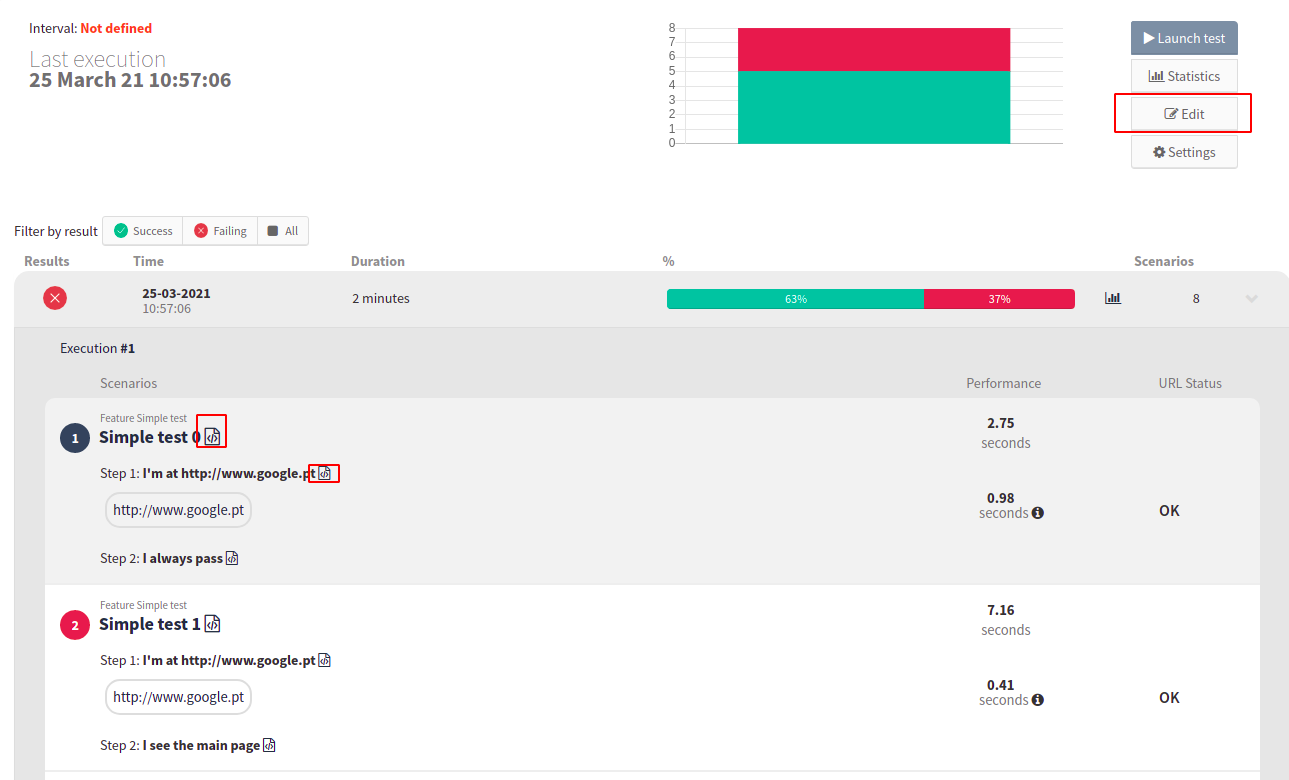
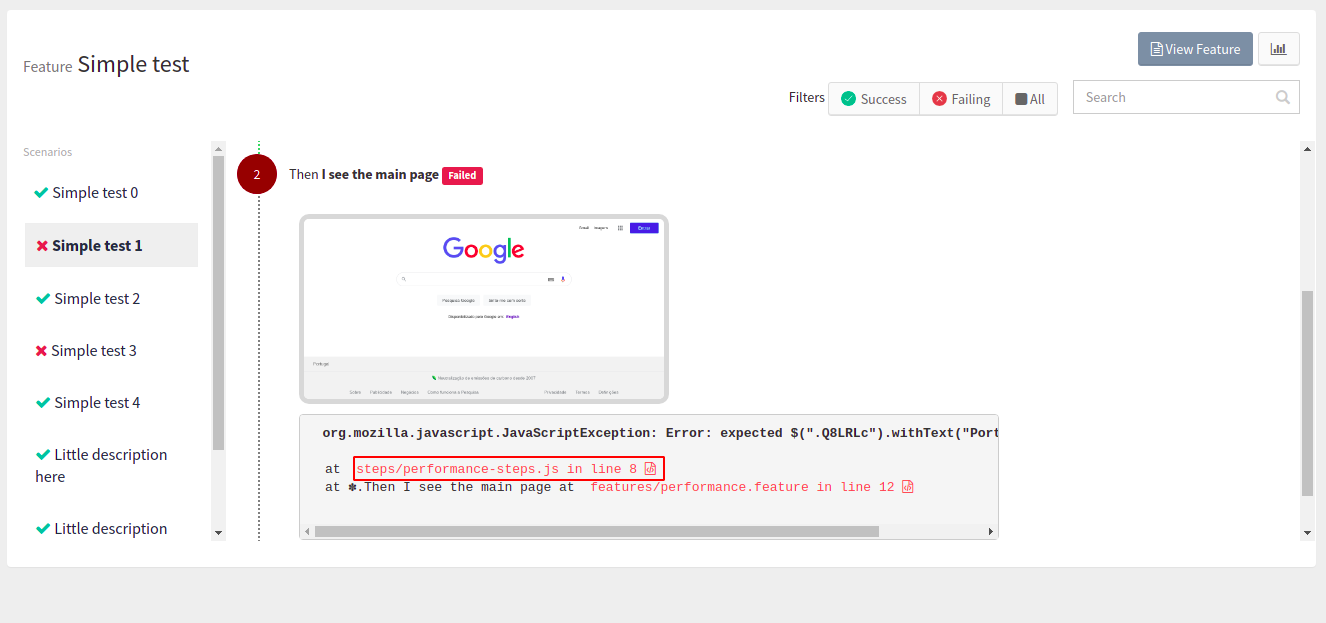
And at the Feature page, at the feature, scenario, step, and the links at the error message will have a shortcut to the editor:
After click on the button or the shortcut to the editor, a new tab will open with the code of the project.
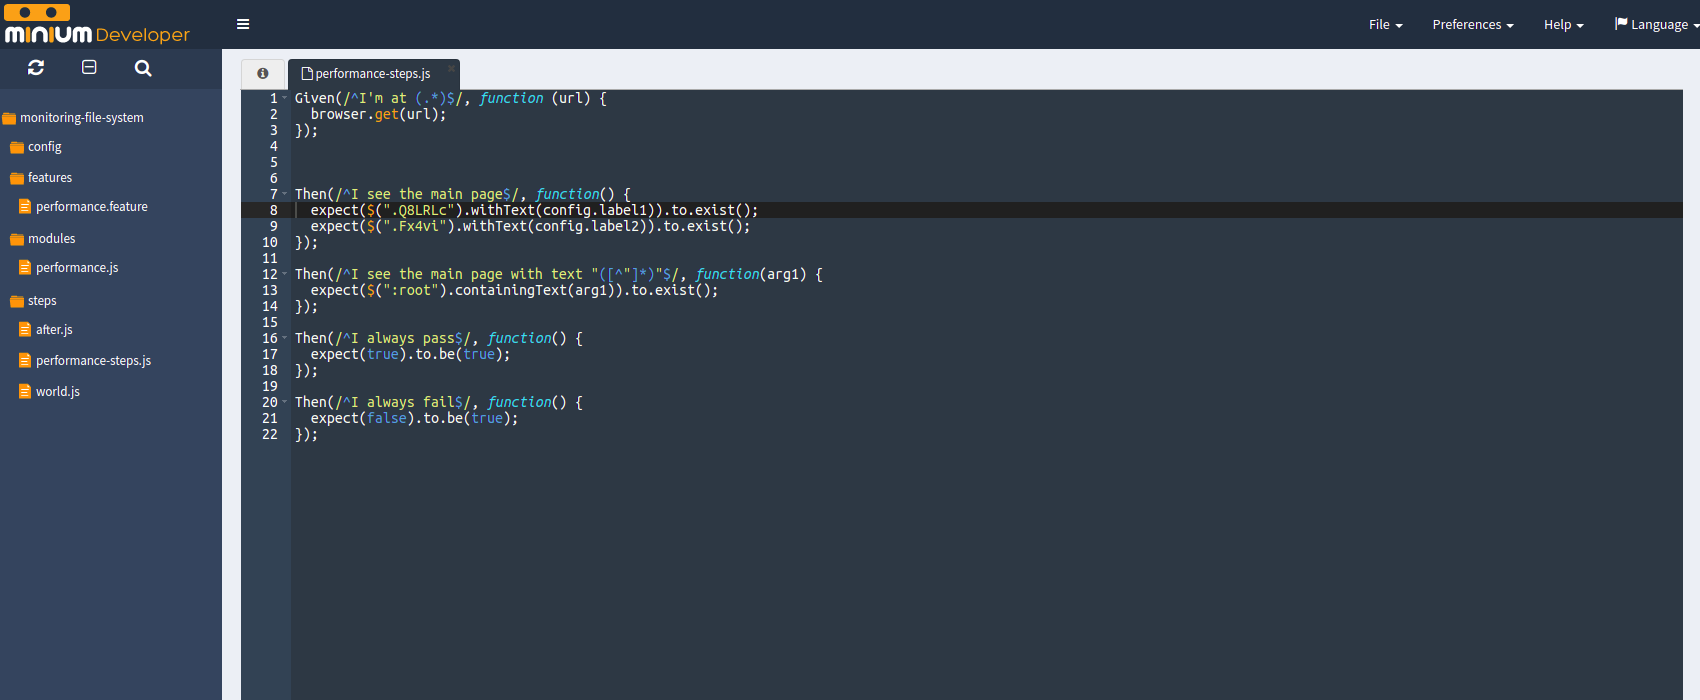
In the editor, we can update the code of the minium project. after the changes, the editor can be closed.
|
Note:
The recorded changes will be reflected in the minium manager. |
2.13. Check the available browsers
To check the available browsers, click on Browsers, at the navigation bar.
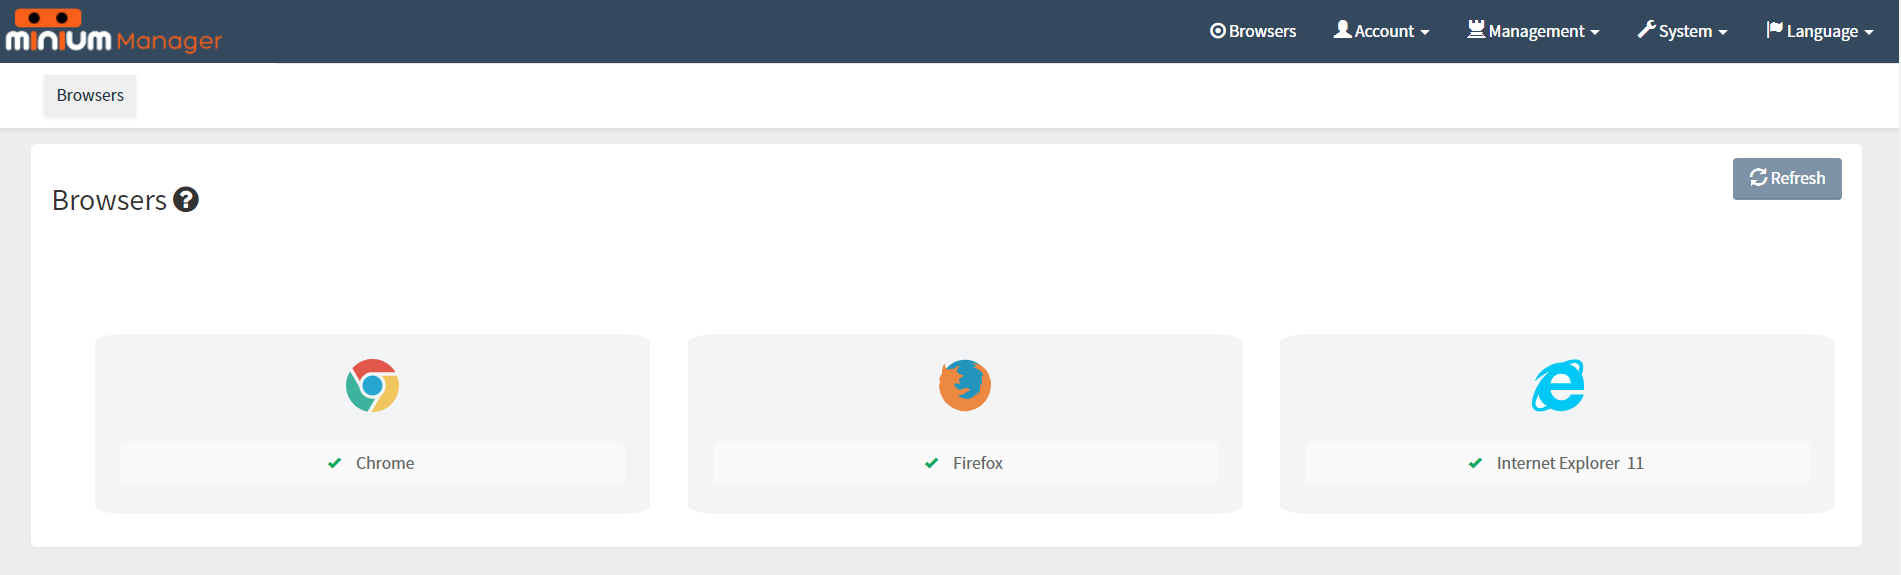
In the figure above, we only have one provider available, but we can have two or more providers configured (e.g. "BrowserStack" and/or "Selenium Grid Extras"). The provider configured has the browsers Chrome, Firefox and Internet Explorer available.
This means that with this environment is able to run the tests in Chrome, Firefox and Internet Explorer at the provider configured.
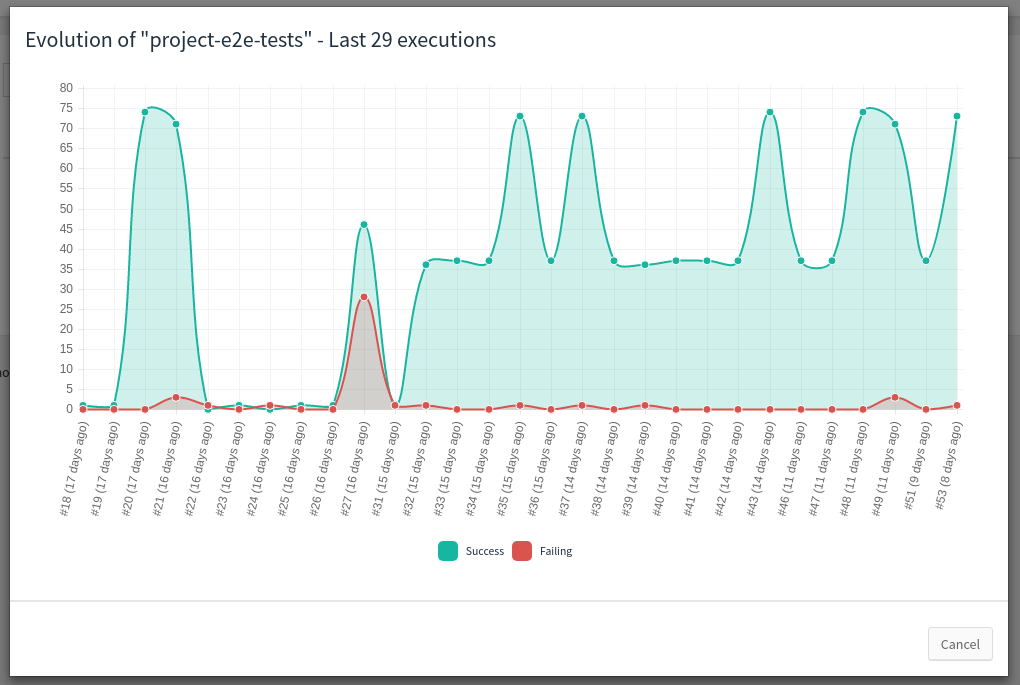
2.14. Project Statistics
Evolution chart to the test executions of a project.
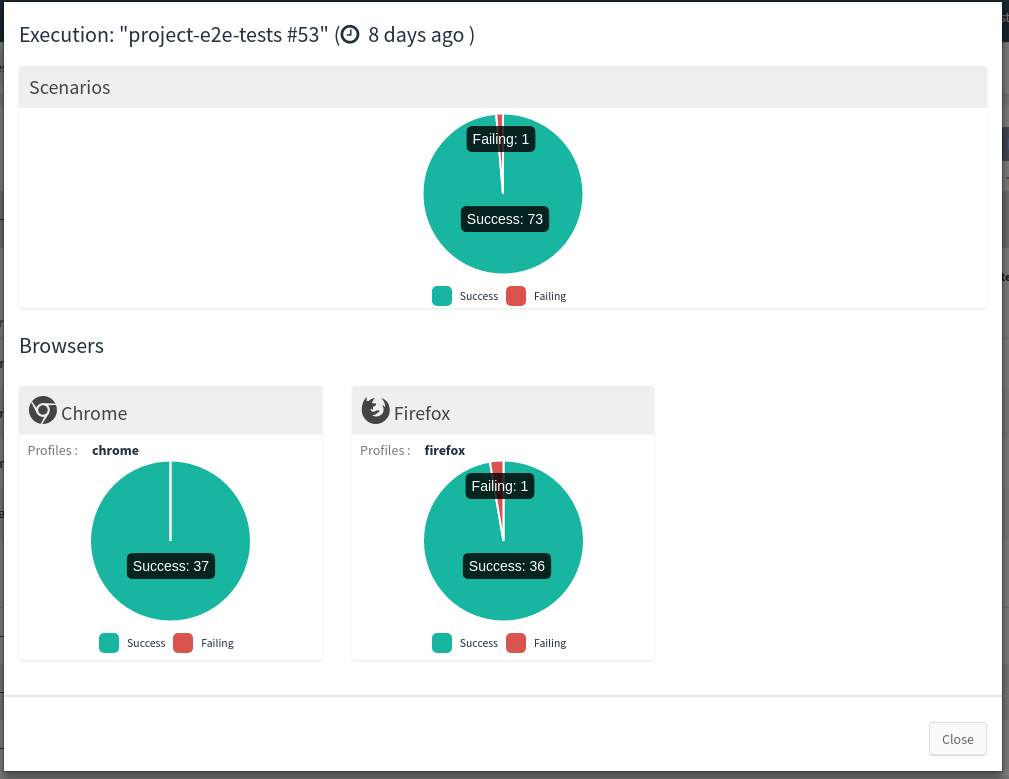
Statistics for a single execution.
3. Test executions
3.1. Launch test executions
A test execution will execute the tests present in a project on one or more different browsers. There are alternative ways for launching test executions.
3.1.1. Launch a test execution manually
On the homepage or the page of a project, click on button Launch test, which opens a modal for selecting the browsers.
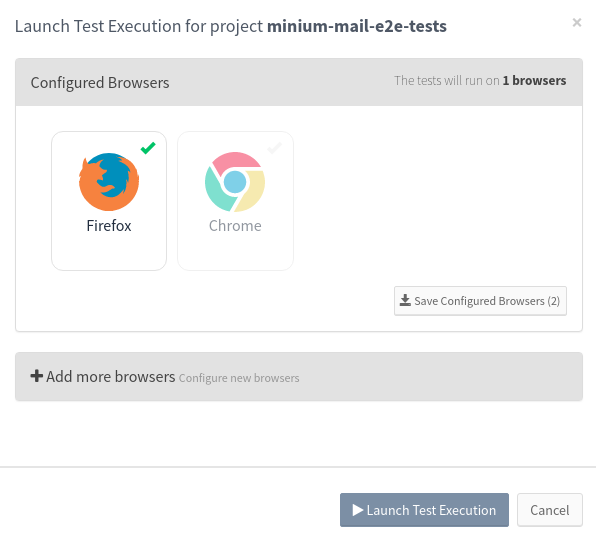
Select the desired browsers by clicking on them. If needed, click on Add more browsers to expand the available browsers and select a browser (and the properties) and/or the mobile devices (emulated via chrome).
After, click Add browser or Add device (for mobile devices).
Then, click on Add browser.
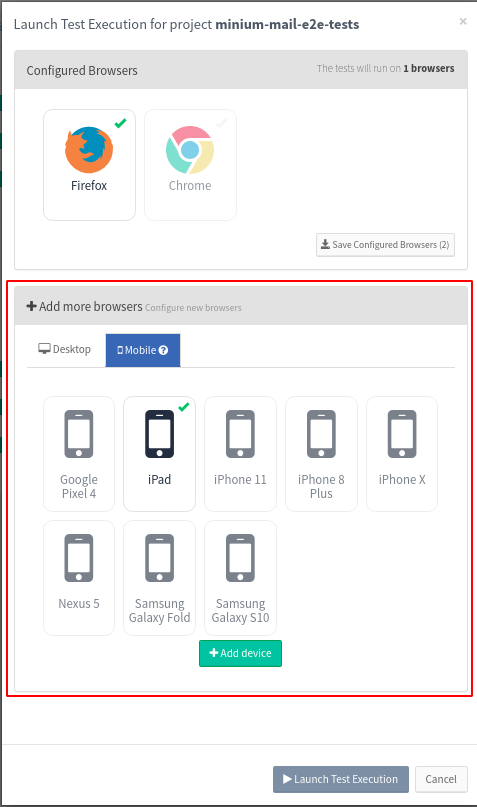
The new browser is now available to be selected on the Configured Browsers.
To save the current browser(s) configured to the project configurations, click Save Configured Browsers to persist the browser configured. Next time you open the launch modal it will show the Configured Browsers saved. Also, the executions created by the scheduler, will use the configuration saved.
After selecting all the browsers, click on Launch Test Execution.
|
Note:
At the click on button Launch test, the Monitoring and Cookie projects don’t open a modal for selecting the browsers. It launches a test immediately.
|
3.1.2. Schedule test executions
Go the configurations of a project and open the Browsers tab to see the currently configured browsers.
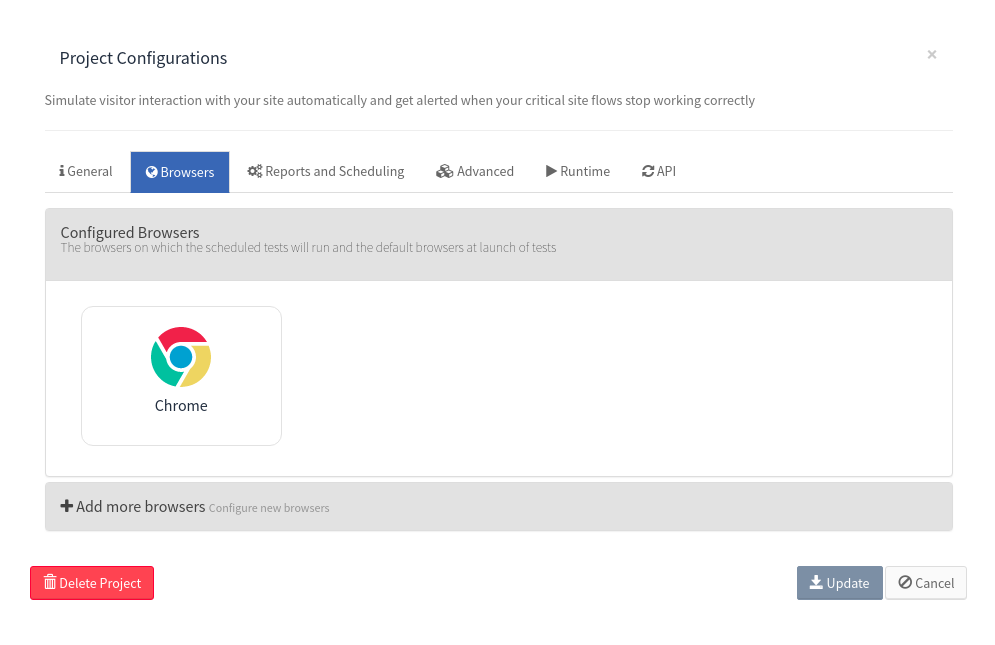
Click on Add more browsers and add more browsers if needed.
To schedule test executions on the configured browsers, switch to the Reports and Scheduling tab.
3.1.3. REST API
Minium Manager provides a REST API through which it is possible to launch test executions and get test results. In order to use it, an API key is required. API key are specific of a project. To generate a key, go to the API tab on the configurations of a project and click on the Generate button.
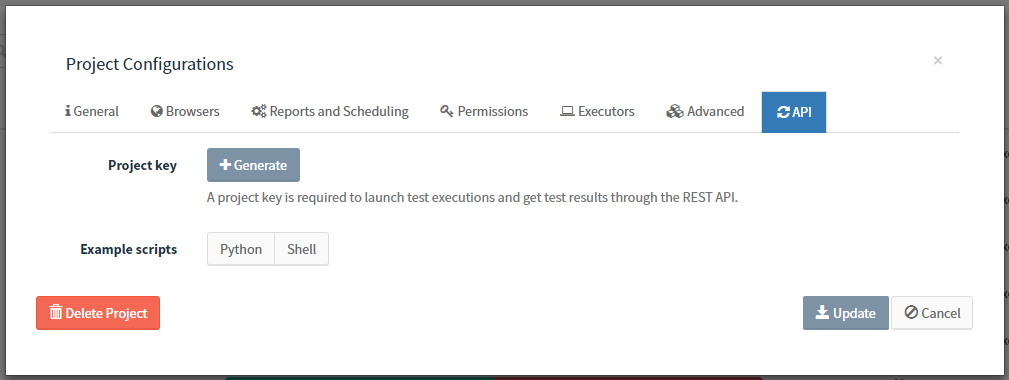
Also, on the API tab are some example scripts. Once the project has an API key, the scripts will be fulfilled with the project-specific data and ready to use. The first part of the script shows how to launch a test execution.
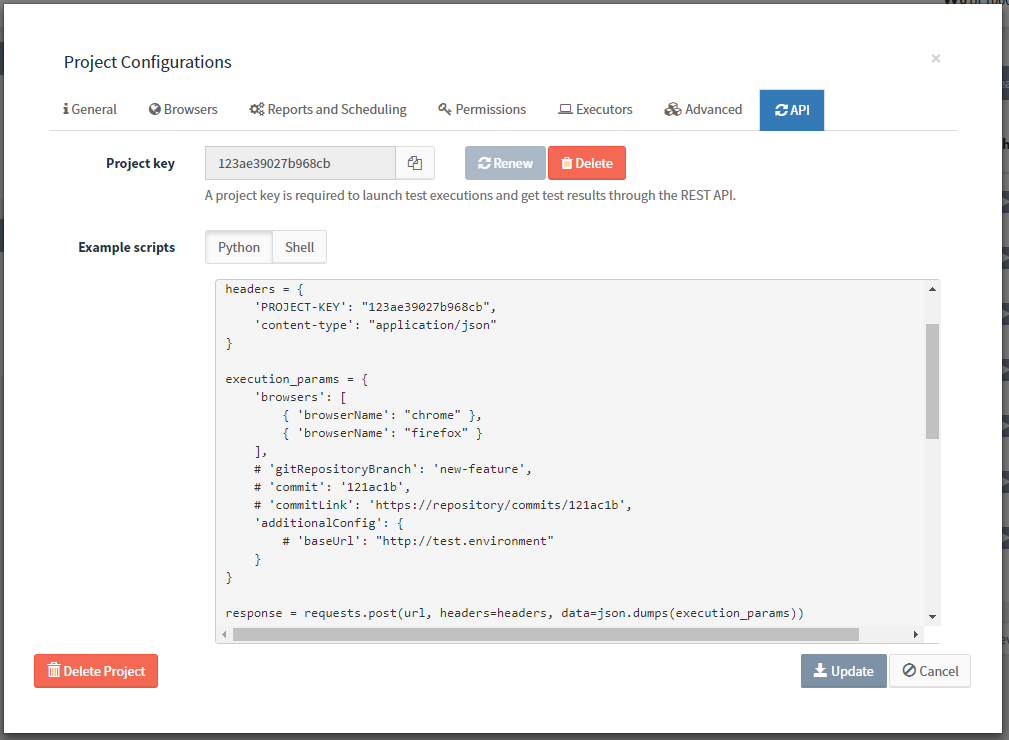
A test execution can be launched by issuing a POST request to api/projects/<PROJECT-ID>/test-executions containing the PROJECT-KEY header set to the project key, and the content-type header set to application/json. The execution parameters are sent in JSON on the request body:
-
browsers: list containing the capabilities of the browsers. Only the
browserNameis mandatory. -
additionalConfig (optional): configuration properties to be merged with the ones on the
application.ymlfile of the project. Properties already defined on theapplication.ymlfile are overridden. -
gitRepositoryBranch (optional): branch of the repository of the tests.
-
commit (optional): the corresponding commit of the system under test, to be then included on the report of the execution.
-
commitLink (optional): link to directly access the commit from Minium Manager.
To follow the progress of the execution until it finishes, poll the URL returned on the Location header of the response to the POST request.
url = response.headers['location']
response = requests.get(url, headers=headers)
while response.status_code == 404:
    time.sleep(5)
    response = requests.get(url, headers=headers)
if not response.ok: sys.exit(response.text)

execution = response.json()
while execution['state'] != "FINISHED":
    time.sleep(15)
    execution = requests.get(url, headers=headers).json()
While the tests are running, the response will be a JSON object containing the state field set to RUNNING, the name of the current browser and the corresponding progress in percentage, number of passed/failed and last finished feature/scenario. Example:
{
  "state": "RUNNING",
  "browser": "chrome",
  "progressInPercentage": 18,
  "failingScenariosCount": 1,
  "passingScenariosCount": 5,
  "feature": "Login",
  "scenario": "Successful login"
}
Once the execution finishes, the response will have state FINISHED, the global results and the number of passed/failed scenarios for each browser. Example:
{
  "state": "FINISHED",
  "globalResults": {
    "totalScenarios": 20,
    "percentageOfPassingScenarios": 95,
    "passingScenarios": 19,
    "failingScenarios": 1
  },
  "browserResults": [
    {
      "browser": {
        "browserName": "chrome"
      },
      "passedScenarios": 10,
      "failedScenarios": 0
    },
    {
      "browser": {
        "browserName": "firefox"
      },
      "passedScenarios": 9,
      "failedScenarios": 1
    }
  ]
}
3.2. Follow the progress of a test execution
After launching a test execution, follow the progress in the project page. See the browser where the test is executing, the percentage, number of executed tests, the elapsed time and the test that is currently executing.

4. Monitor test results
In a project page, all the launched executions are showed:
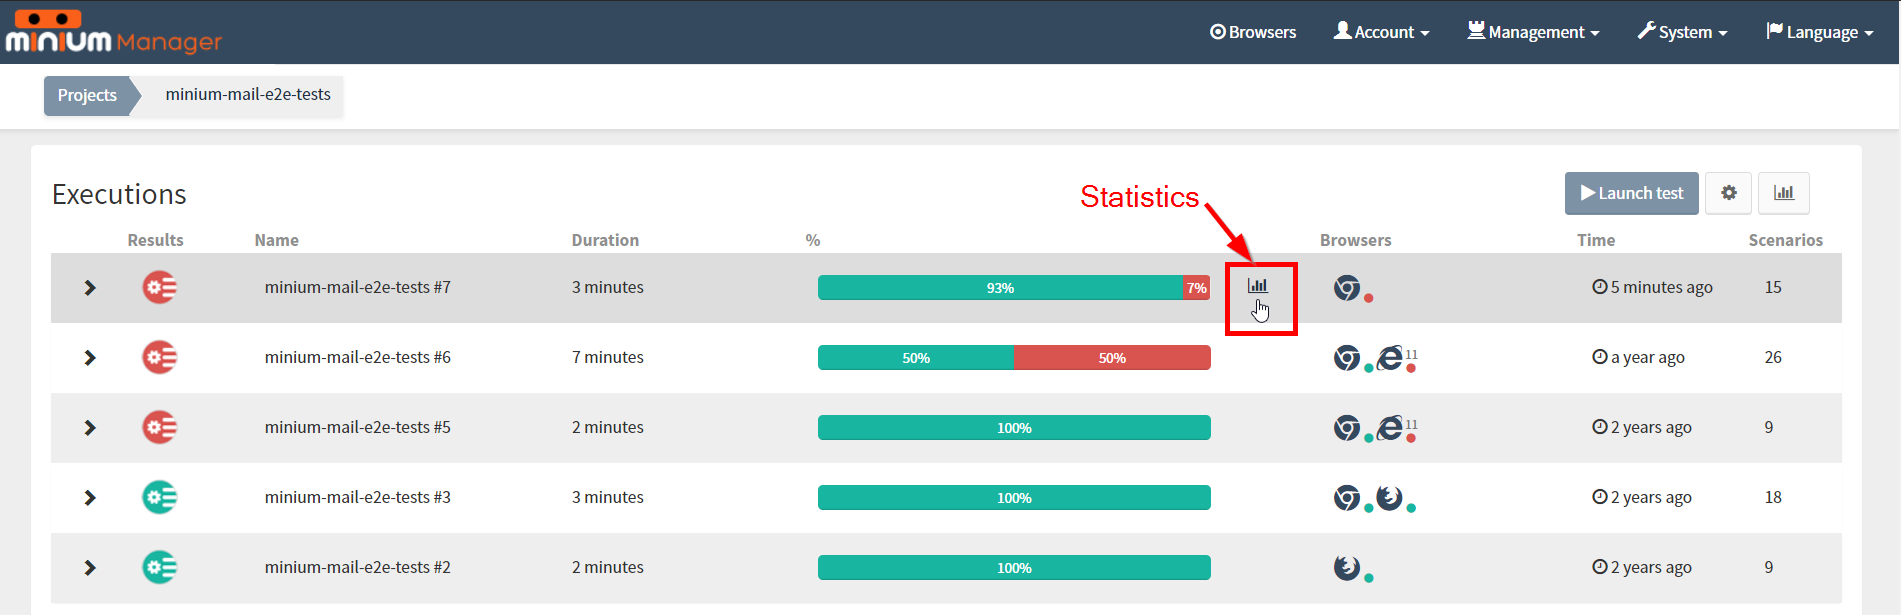
For each execution it can be seen:
-
result of the execution
-
name
-
duration of execution
-
percentage of passed and failing scenarios
-
statistics of the execution (shown when the mouse is over the execution)
-
browser where the execution ran
-
launch time
-
number of scenarios of the execution
When expands a test execution a list of executed features, and their results can be seen:
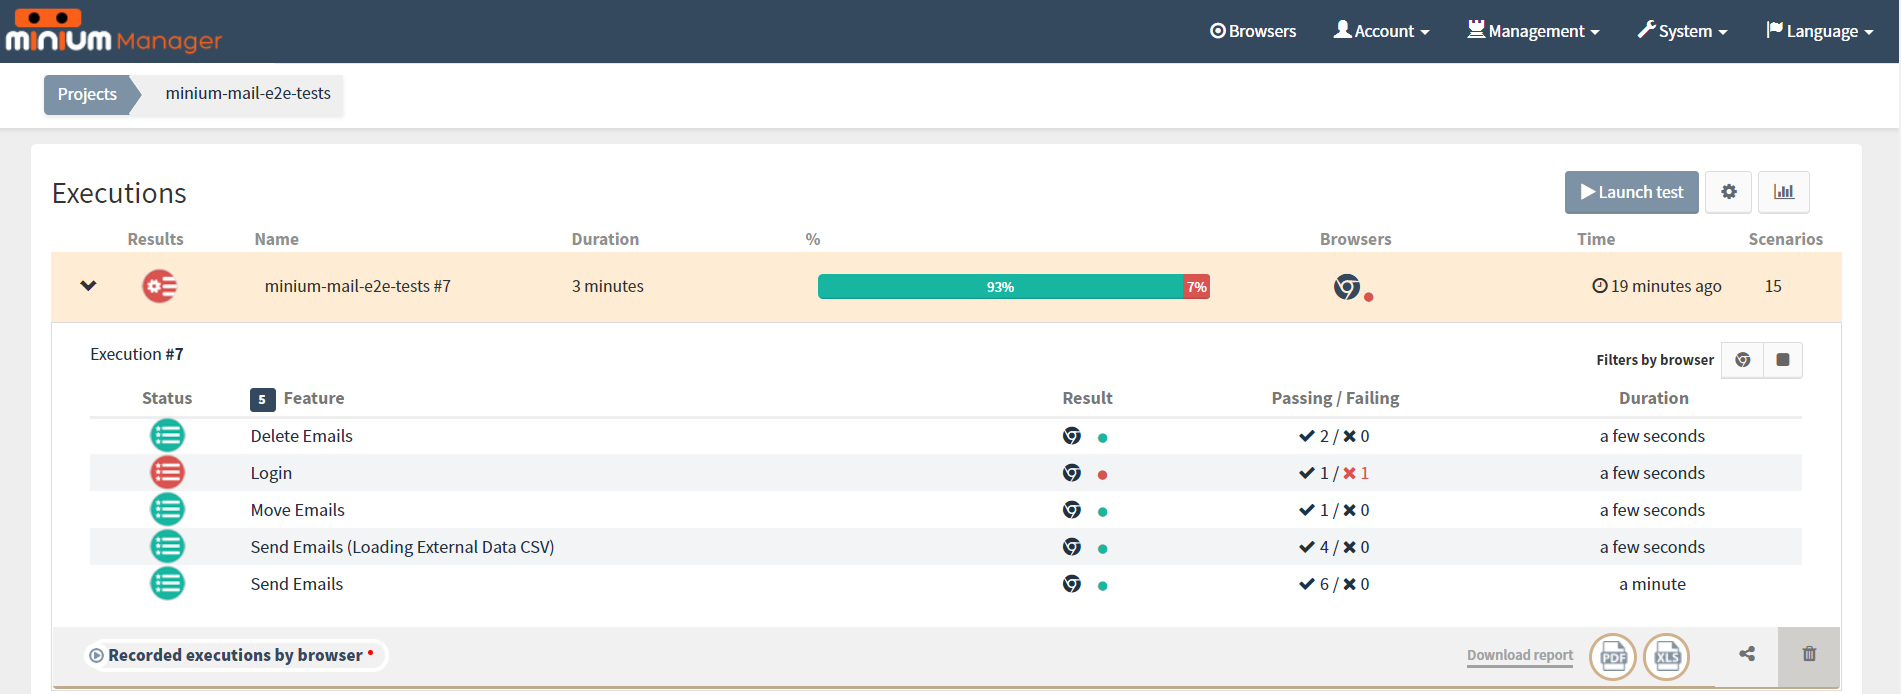
For the execution expanded it can be seen:
-
features tested
-
the results detailed for each feature (with filters)
-
videos of the execution
-
download the report of the executions (MS excel and PDF)
-
remove execution
Click at "Recorded executions by browser" to see the videos of the recorded executions:
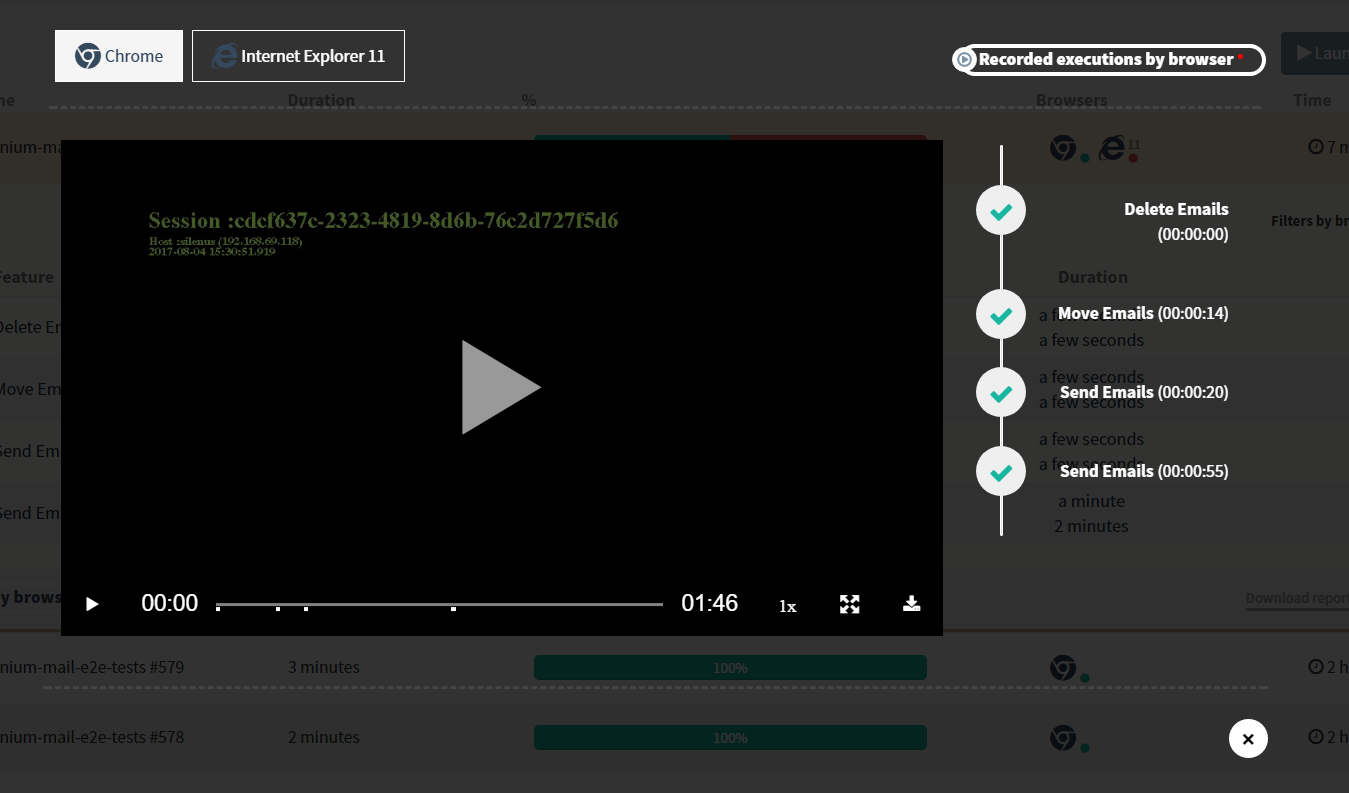
For the videos (at execution) it can be seen:
-
videos for the browsers tested
-
features to navigate through the video
-
cue points when the feature starts on the video
Monitoring project
The result of an execution of a Monitoring project is presented at the execution page:
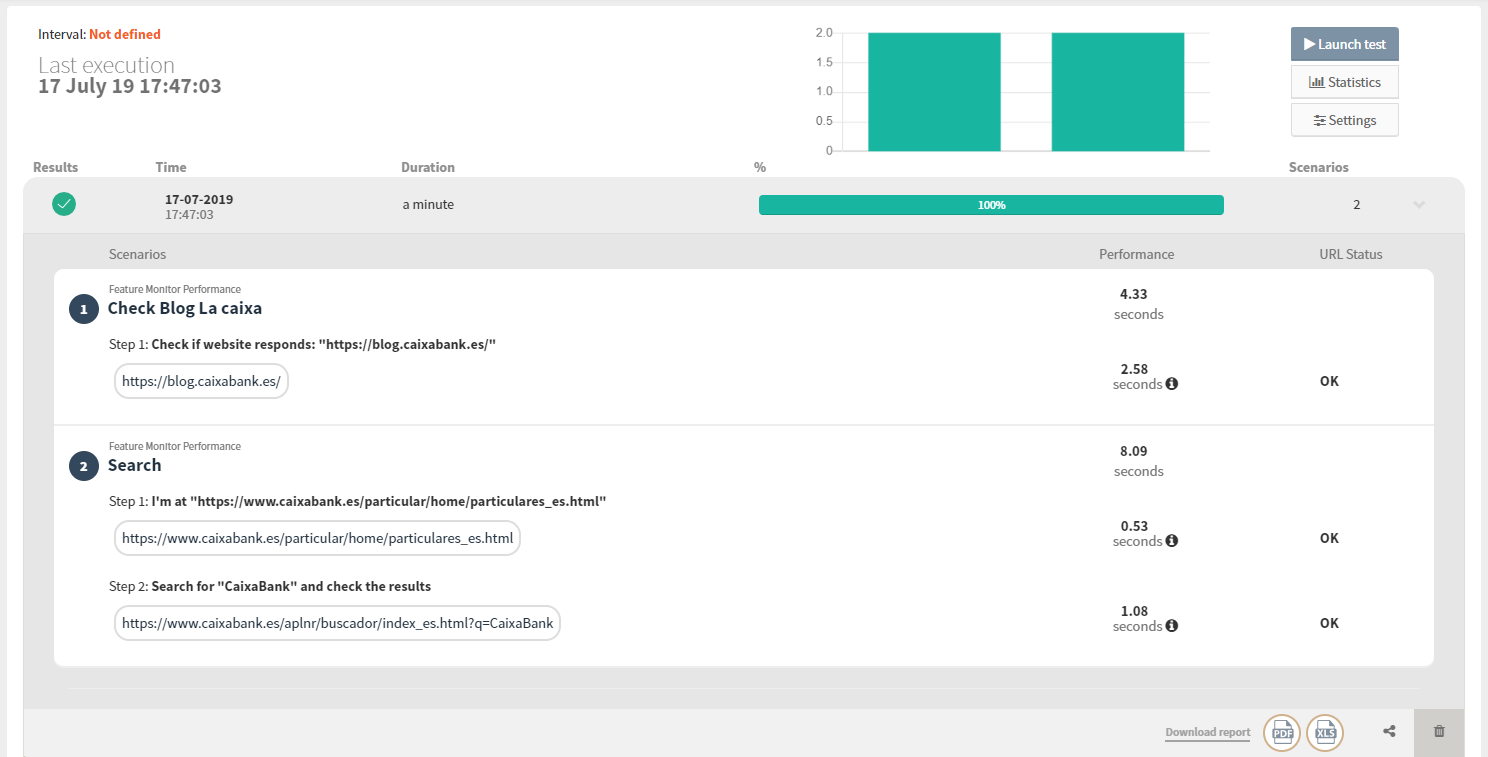
At execution page, we can see the time of each URL took to load. Also, we can see the URL status, and the time it took to execute the scenario.
Display options
The information at the execution page can be filtered to show/hide some details.
To open the Display options click at Settings:
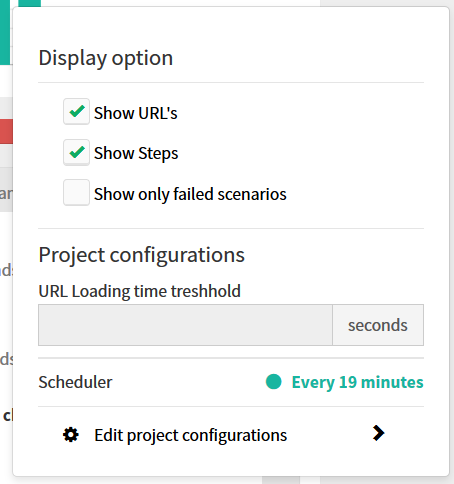
The display options allow us to:
-
Show/Hide the URL’s
-
Show/Hide the steps
-
Show only the failed scenarios
-
Consult the URL loading time threshold (This property is configured at the project configurations at the advanced tab and warns the user (at the execution page) when the loading time of a URL is higher than the loading time threshold)
-
Consult the scheduler (The scheduled is configured at the project configurations at the reports and scheduling tab)
Cookie project
The Cookie project is divided in two projects: Cookie Report project and Cookie Crawler project.
Cookie Report project
The result of an execution of a Cookie Report project is presented at the execution page:
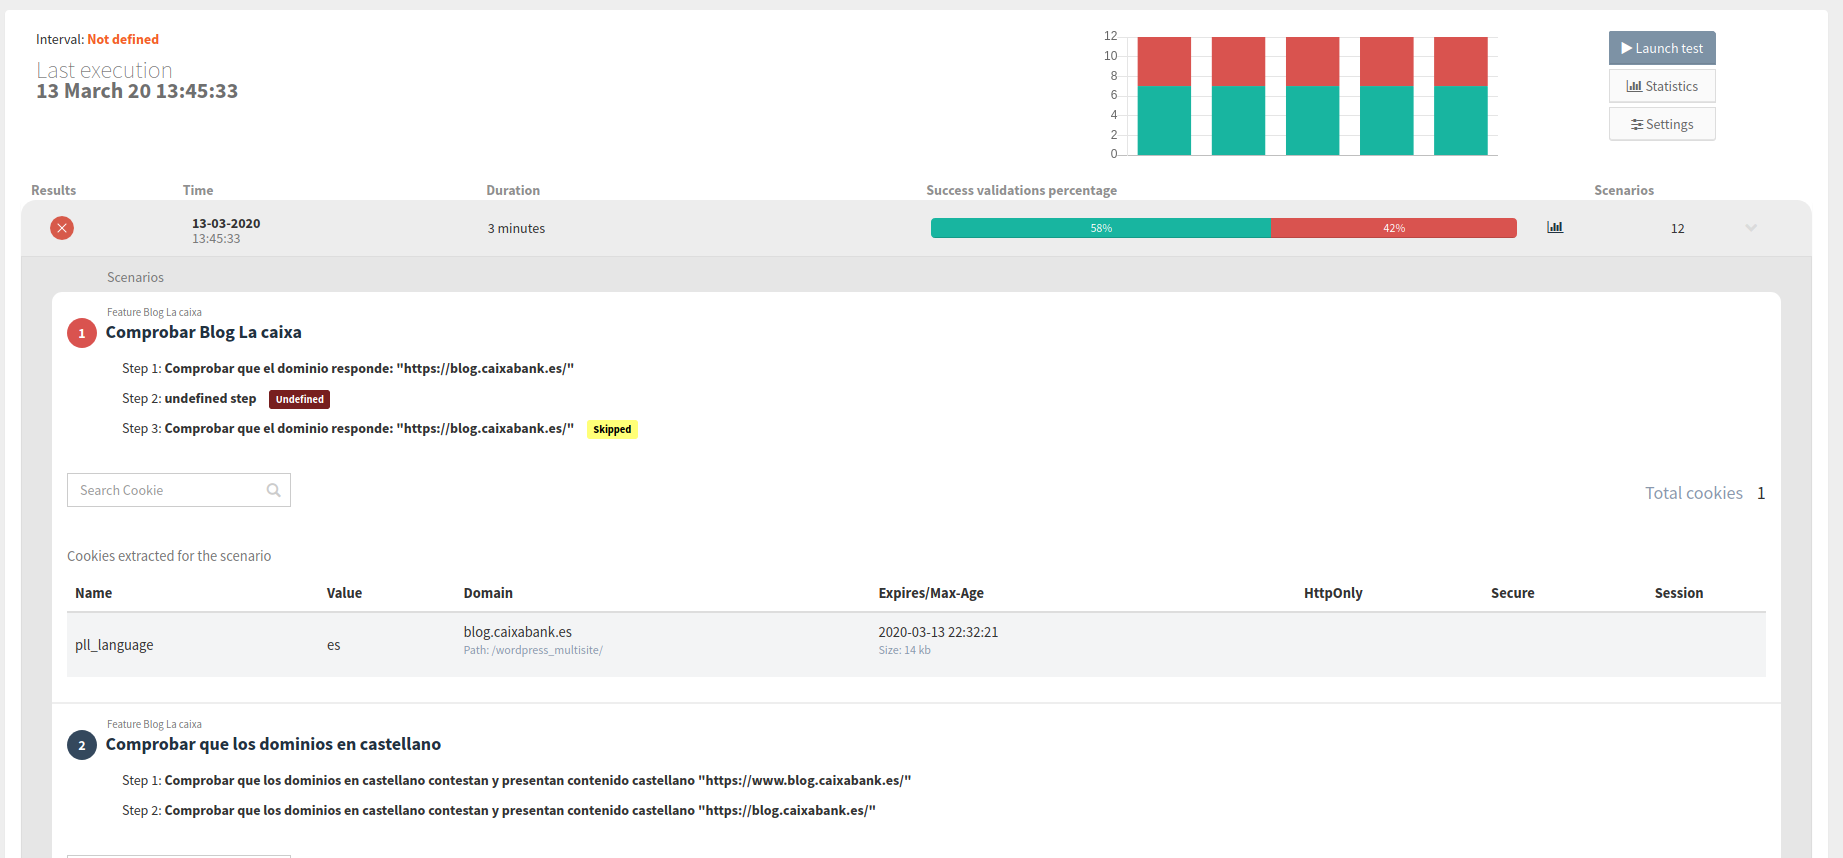
At execution page, we can see at the end of each scenario a table (with a filter) of all browser cookies at the end of a scenario.
Display options
The information at the execution page can be filtered to show/hide some details.
To open the Display options click at Settings:
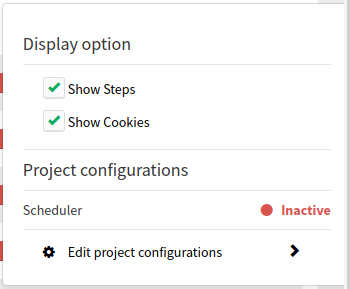
The display options allow us to:
-
Show/Hide the steps
-
Show/Hide the cookies table
-
Consult the scheduler (The scheduled is configured at the project configurations at the reports and scheduling tab)
Cookie Crawler project
The Cookie Crawler project generates a report of the all browser cookies found during the crawl of the websites.
For each execution it can be seen:
-
URL crawler - The URL(s) that was crawled
-
Filters - Domains filtered
-
Cookies Accepted - Tells whether the cookie warning was accepted or not
-
Cookies to validate - Cookies validated during the crawl (click at the eye to see the validations in a table)
-
Max Depth - Depth of the crawl
-
Validation failed - The cookies not found at the report
-
Total Cookies (Distinct by name) - Number of different cookies found at the report distinct by name
-
Total cookies - Number of different cookies found at the report
-
Total URLs - Number of different URLs crawled
There are several tabs to present execution information: Summary, Cookie table and URLs tree.
Summary:
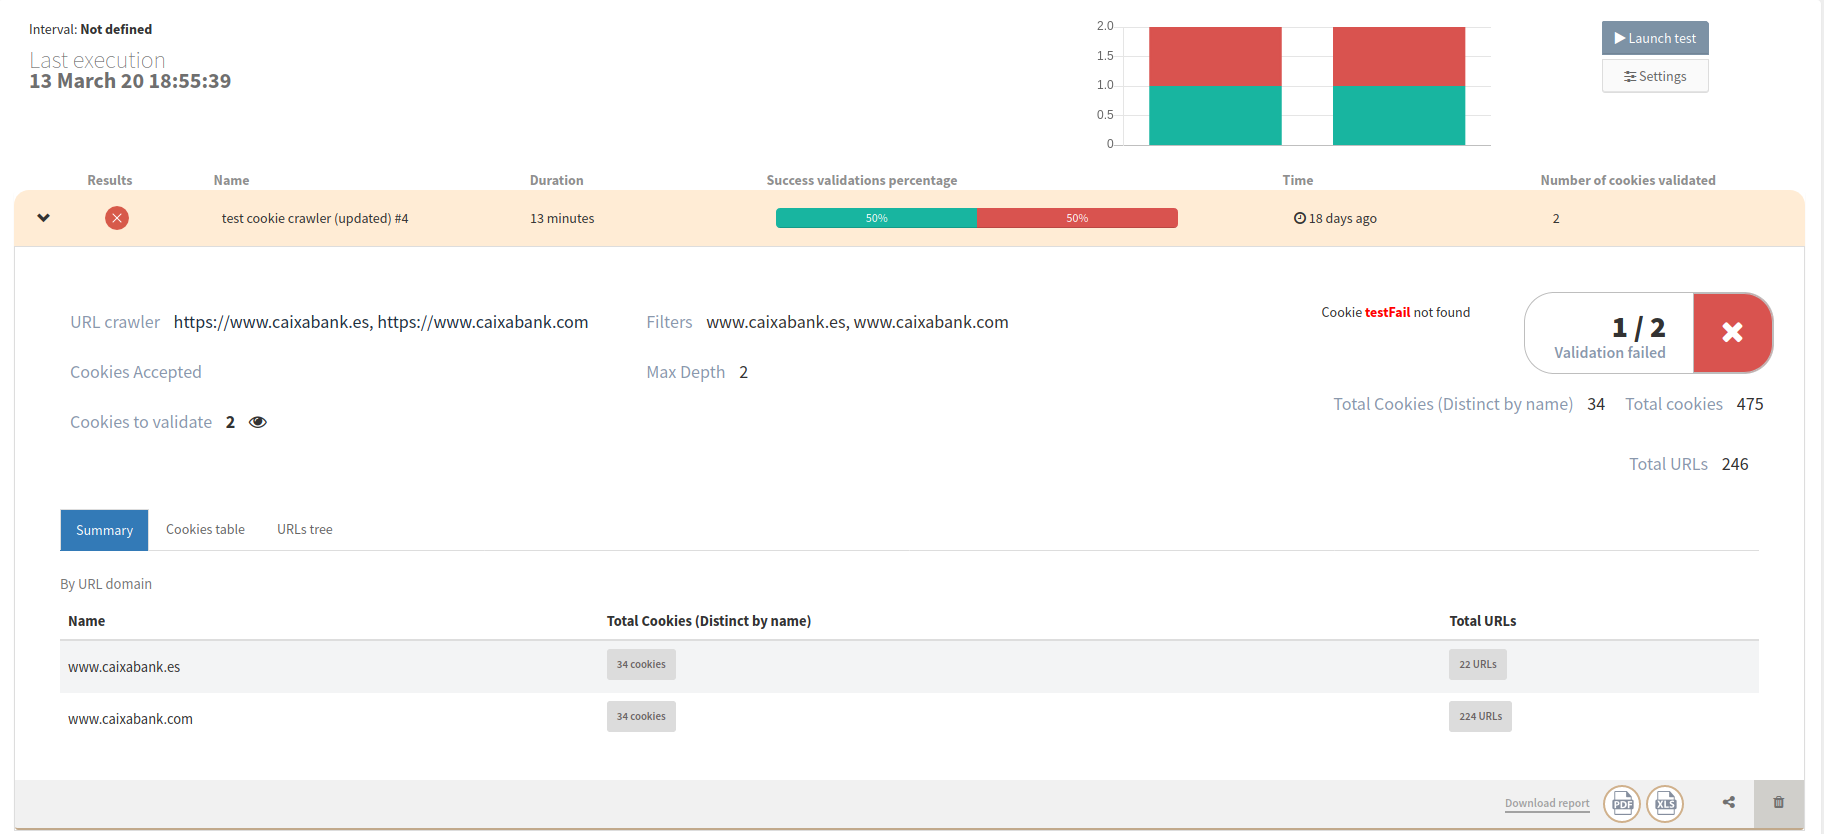
This table presents the information By URL domain.
For the screenshot above we can see that for the domain www.caixabank.es, we found 34 cookies (Distinct by name) in a total of 22 URLs.
Cookie table:
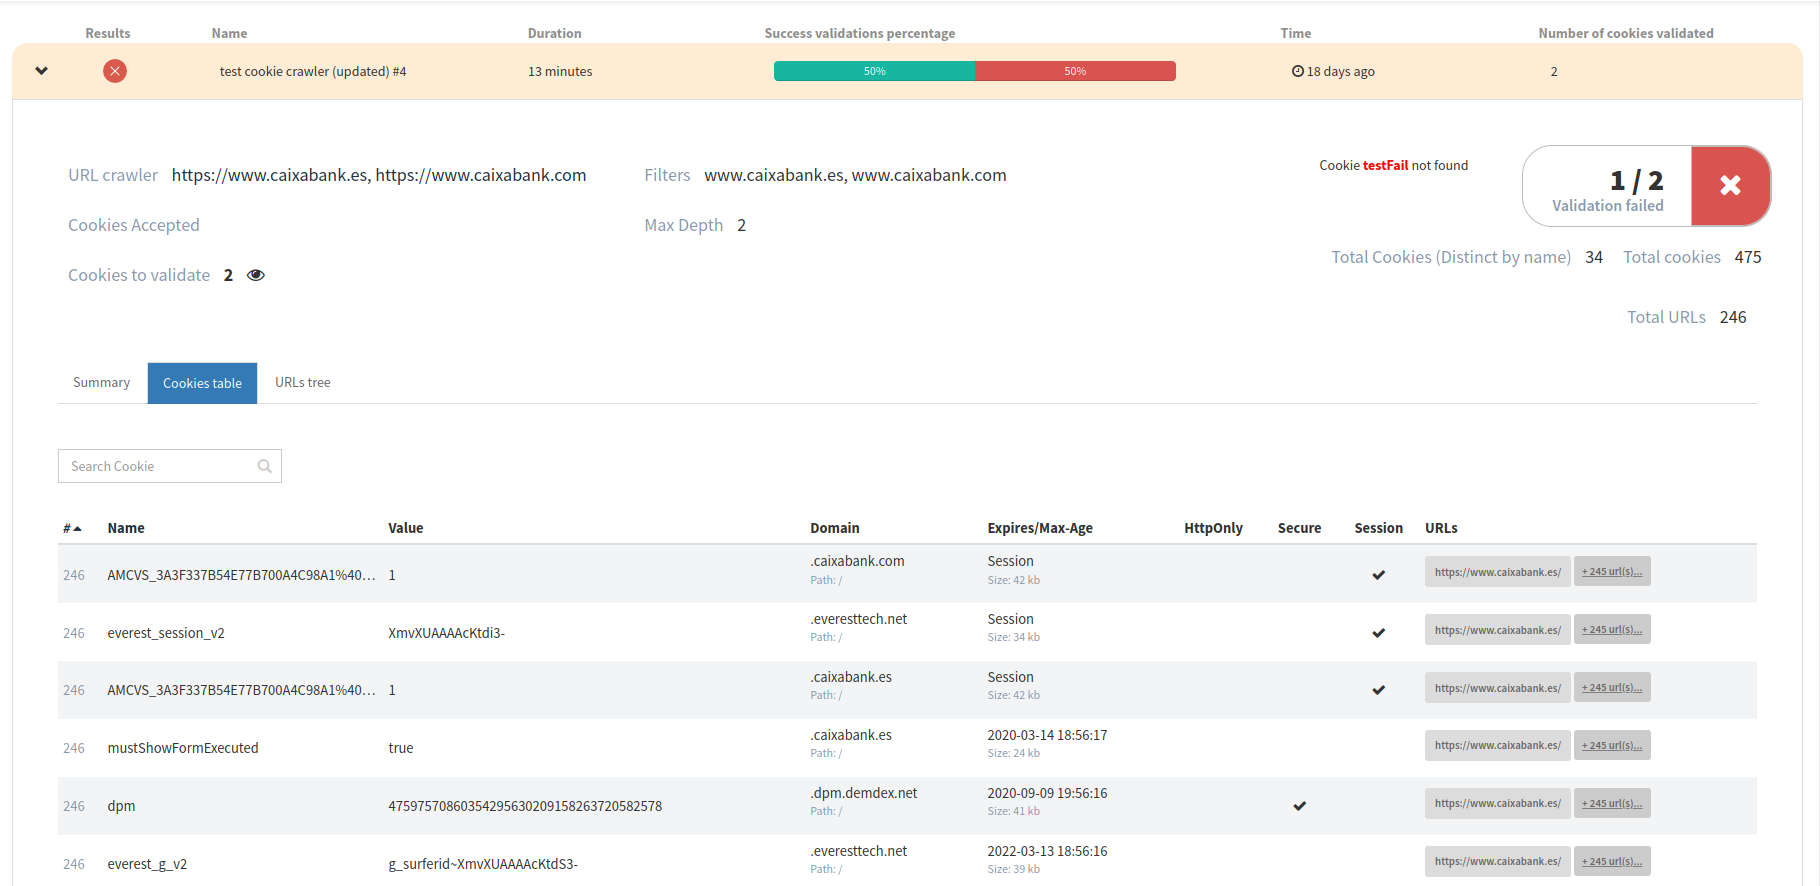
This table presents the all the cookie’s information retrieved at the crawler for the URL(s) crawled, and the URL(s) where the cookie was found.
URLs tree:
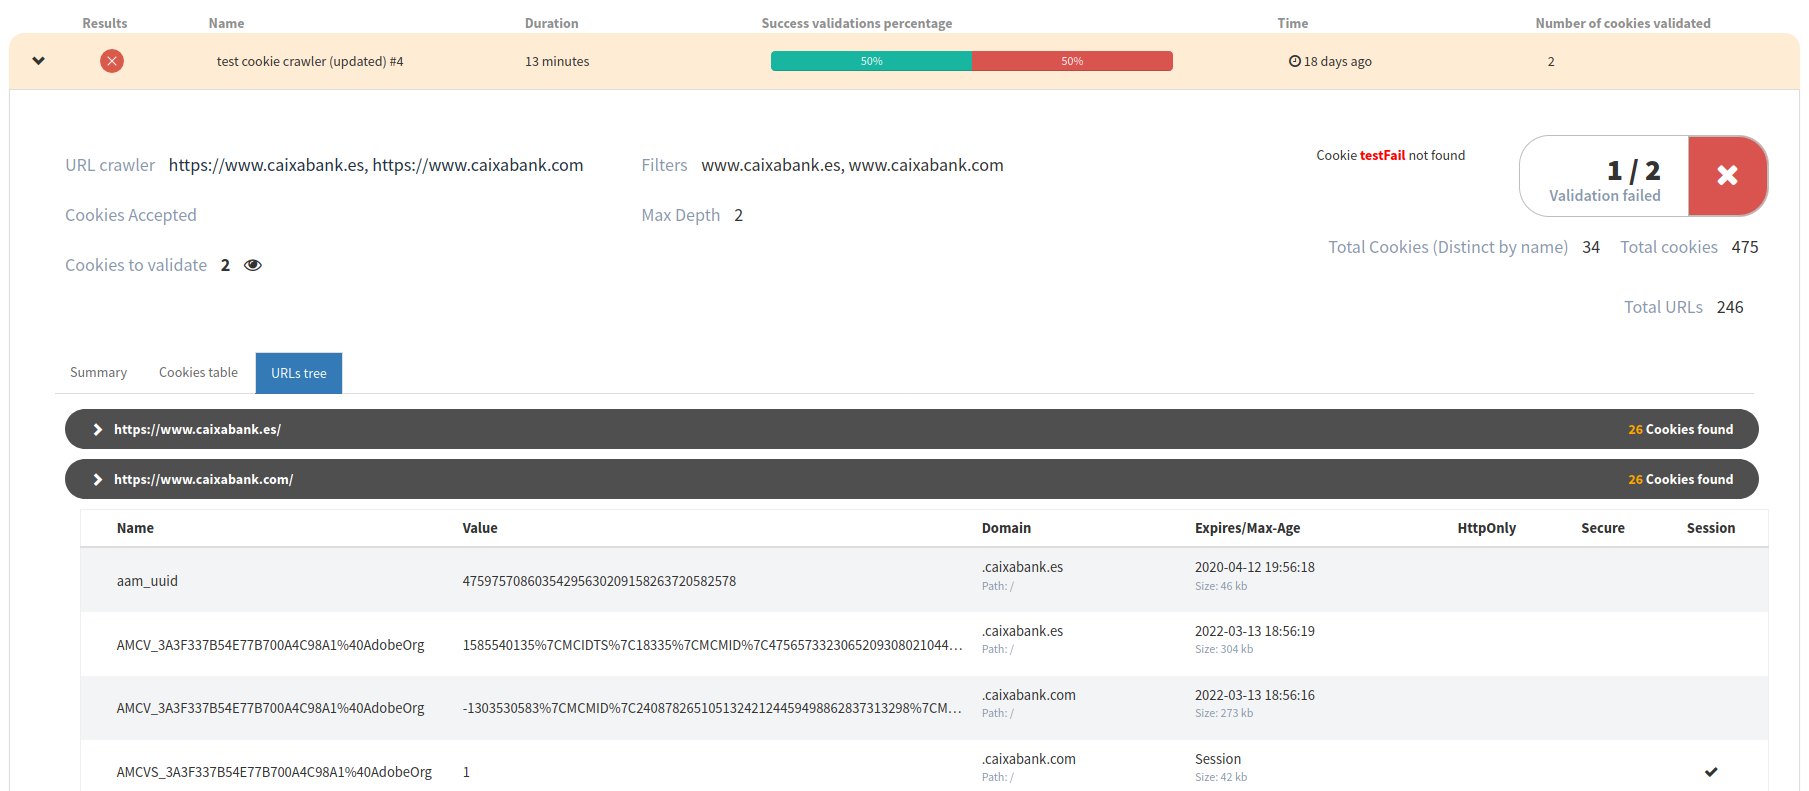
This view shows the URLs tree generated by the crawl, with the cookies found for each URL.
Display options
The information at the execution page can be filtered to show/hide some details.
To open the Display options click at Settings:
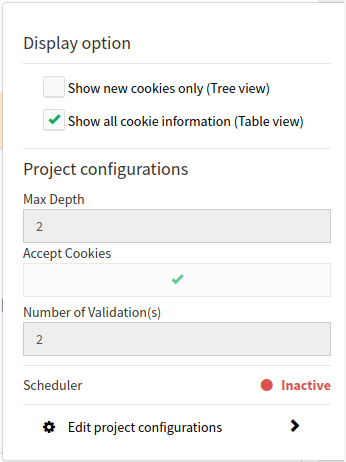
The display options allow us to:
-
Show new cookies only (Tree view) - Only shows the new cookies at the
URLs treein the child levels. The default is show every cookie (even the repeated ones). -
Show all cookie information (Table view) - Shows all the cookie information (this is the fields: domain, Expires/Max-Age, HttpOnly, Secure and Session). The default is to show the Name, Value and URLs aggregated.
-
Max Depth - The Max depth configured at project configurations
-
Accept Cookies - Shows if accept cookies are checked or not at project configurations
-
Number of Validation(s) - Shows the number of validations configured at project configurations
-
Consult the scheduler (The scheduled is configured at the project configurations at the reports and scheduling tab)
On the feature (for web application testing) view check the scenarios of this particular feature:
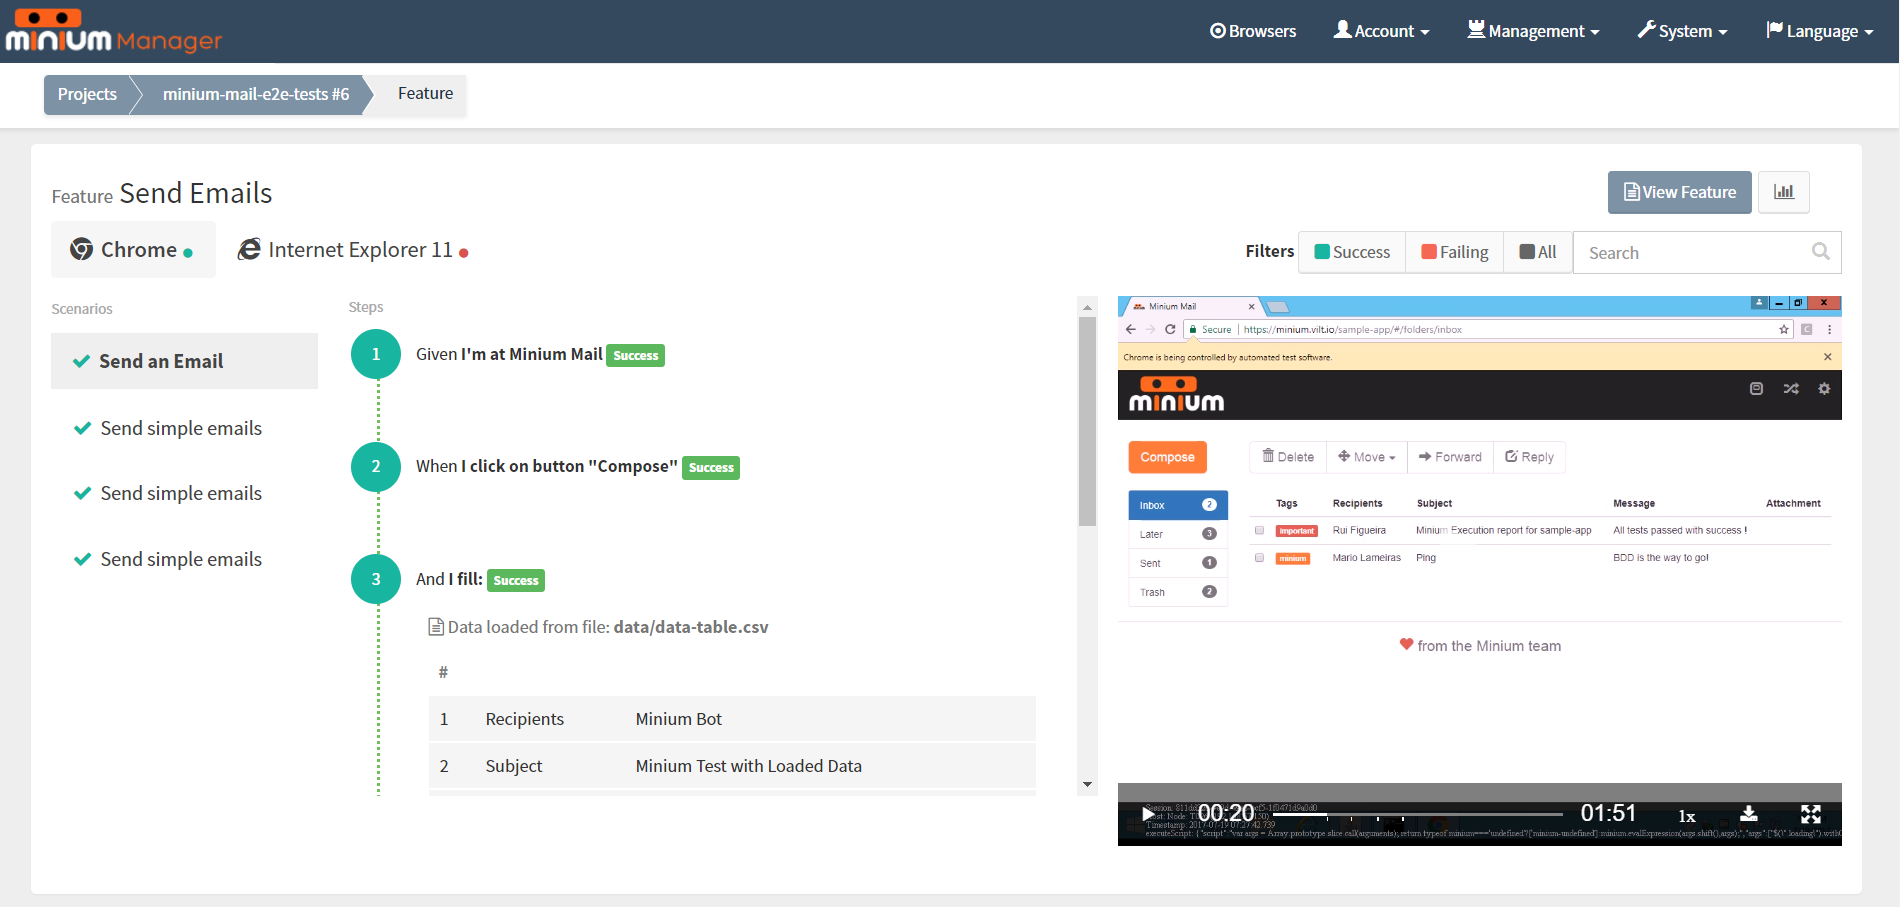
When expands a scenario see all the steps and results. Is easily switch to the results of another browser. More functionalities:
-
Screenshots - Minium Manager provides screenshots of the application at the moment of the failure. So it is possible to see the state of the application in the moment of failure.
-
Error messages
-
Links to the feature or step file for each step.
-
Evolution chart for the projects
-
Video with the cue points when the scenarios start
Monitoring project
Feature page of a Monitoring project scenario:
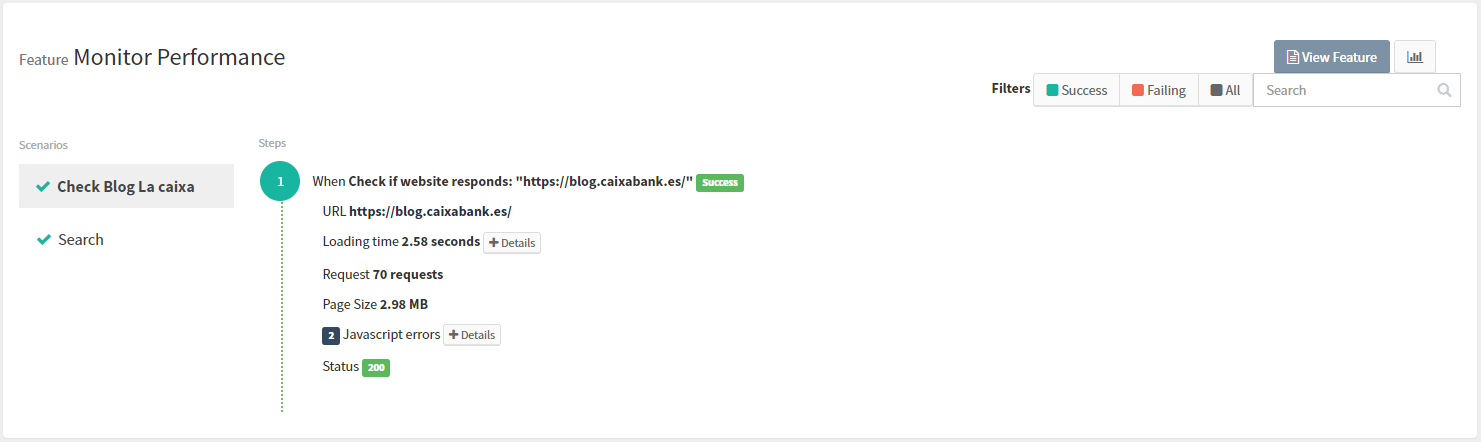
At the feature page, we can see more details about the page load performance:
-
The url loaded
-
The loading time with the times of the Backend Performance, Frontend Performance and DOM Content Loading
-
The number of requests
-
The Javascript Errors (if any)
-
The URL status code
Cookie project
Feature page of a Cookie Report project scenario:
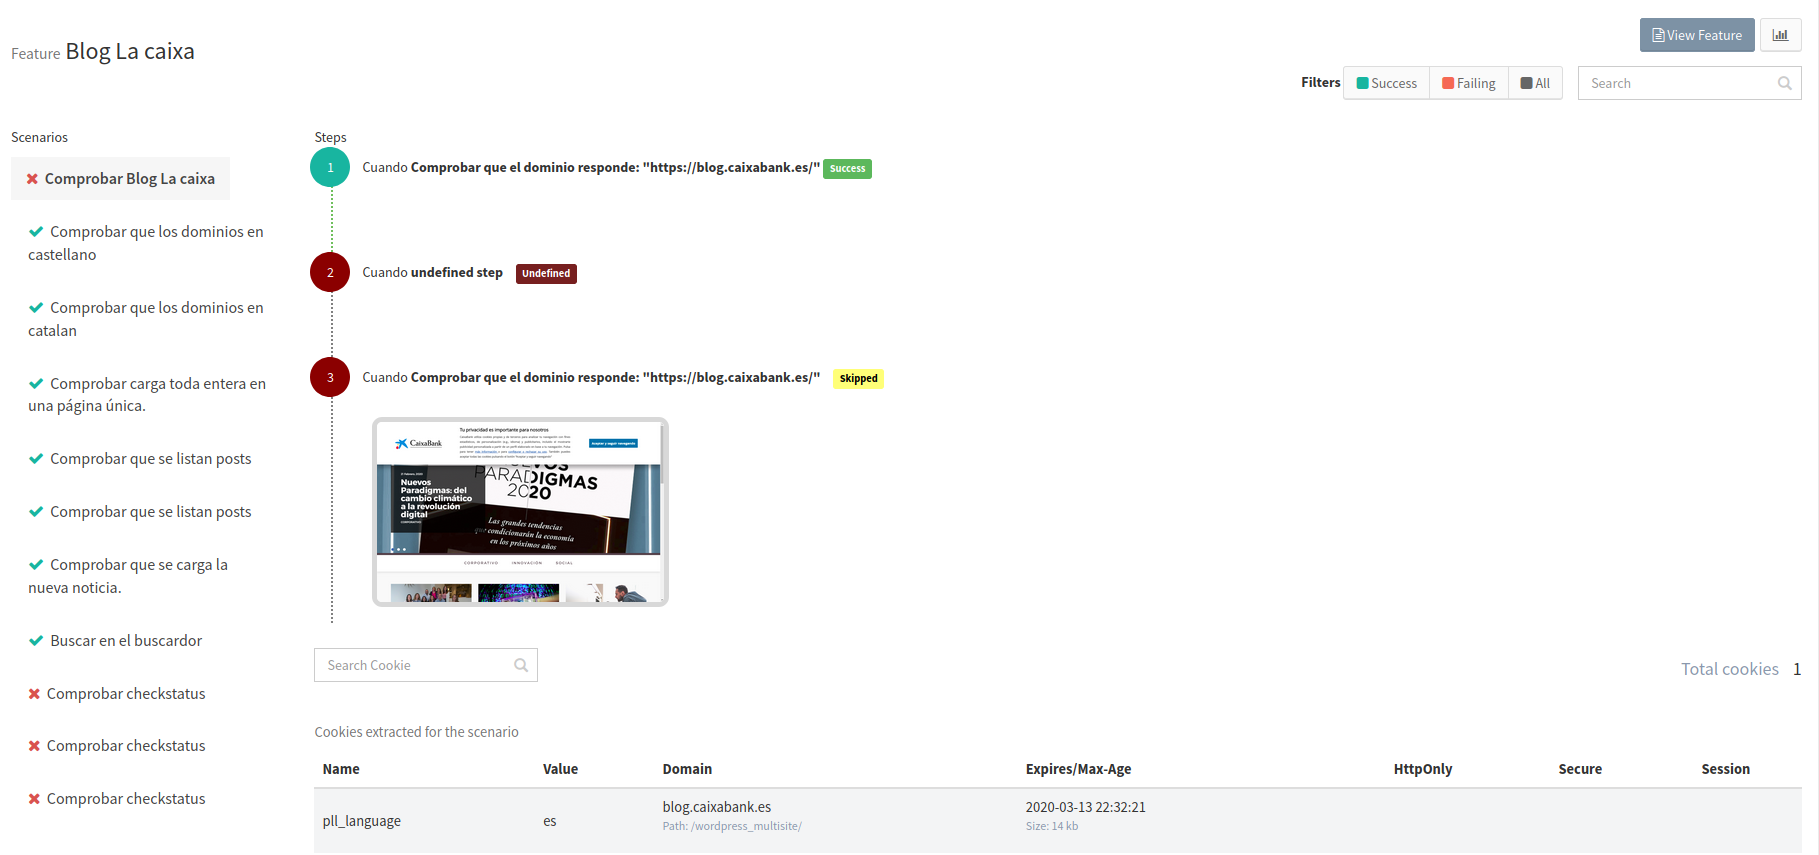
We can see at the end of each scenario a table (with a filter) of all browser cookies.
|
Note:
The Feature overview page is not available to the Cookie Crawler project. |
4.1. Feature overview
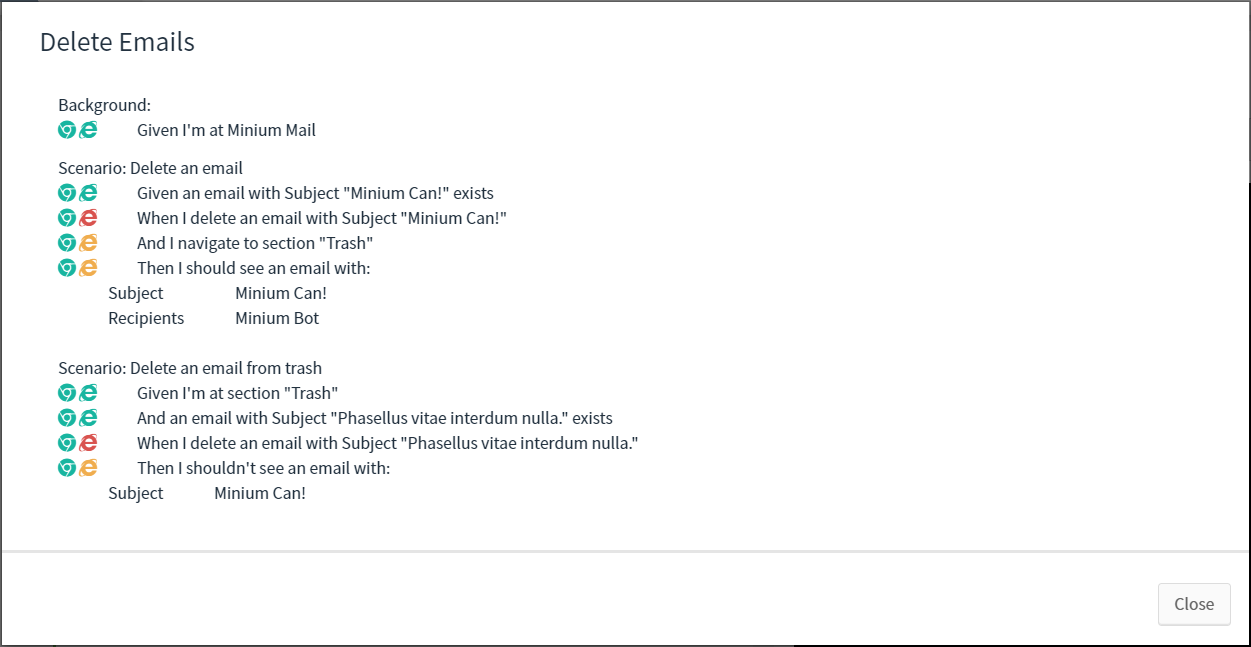
Overview of all the features, by clicking on the button View Feature.
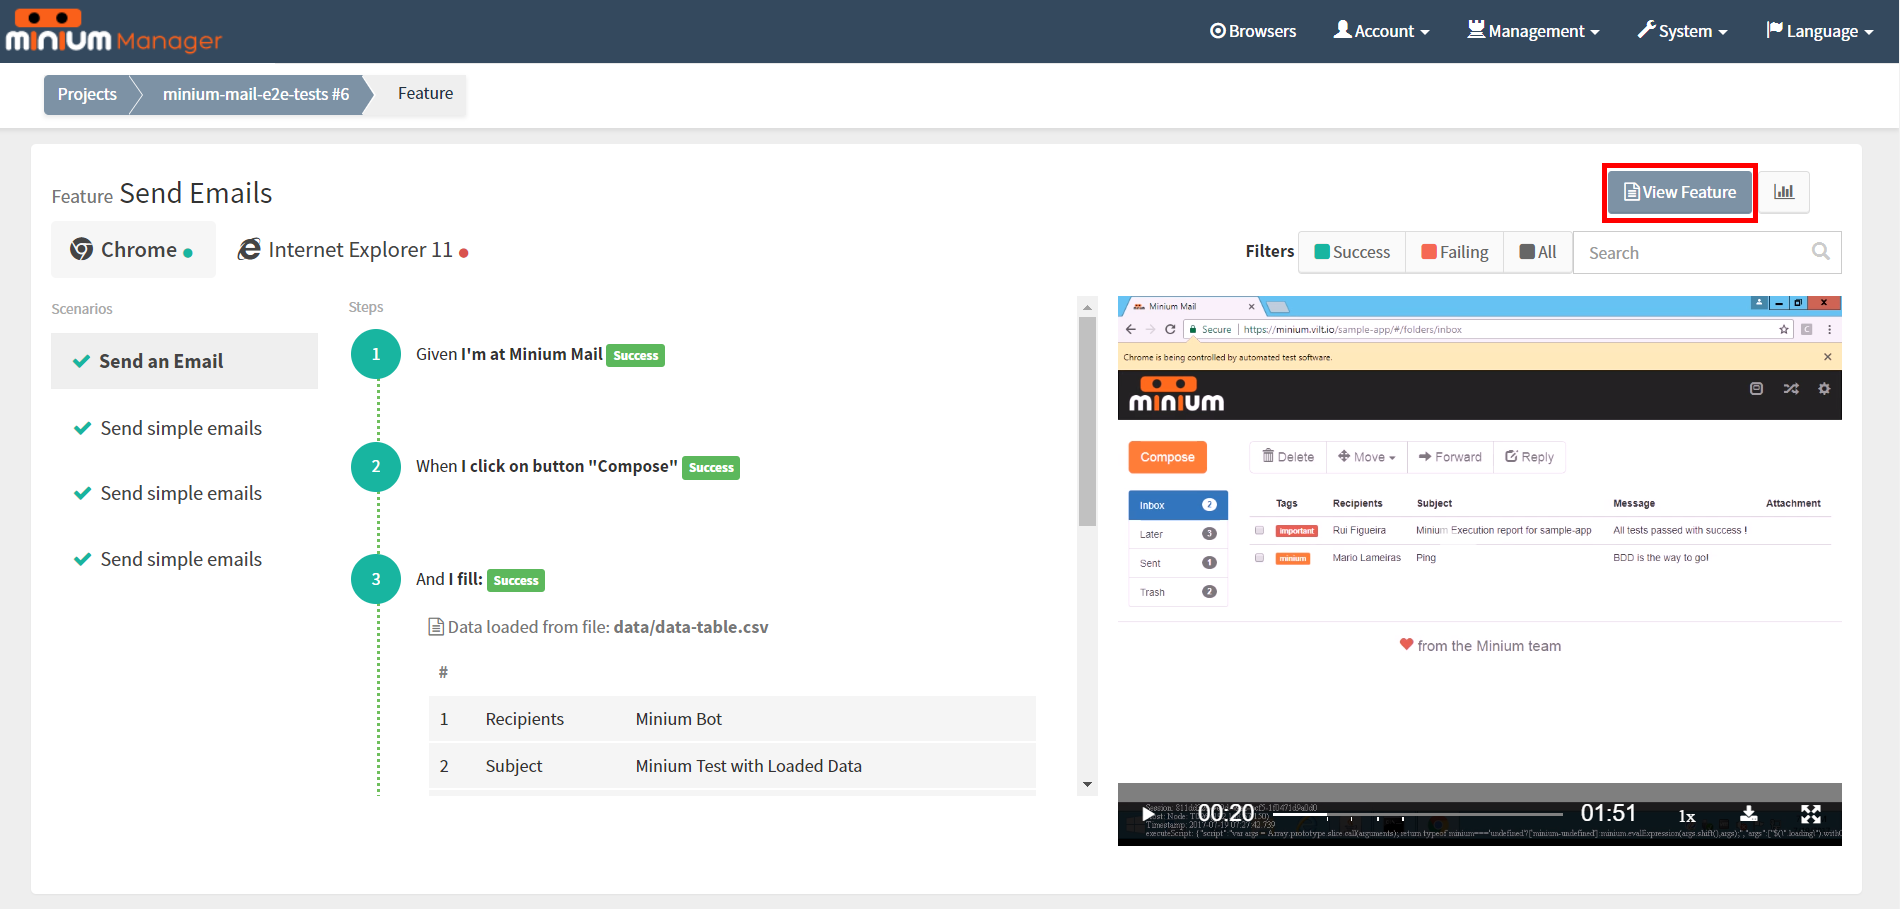
View the result of each step in each browser that the feature ran.
4.2. Reports
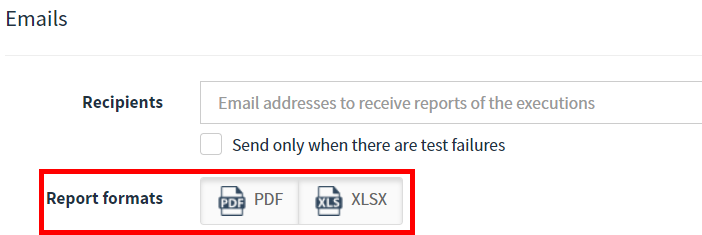
Receive the reports of each test execution, in PDF and/or Excel formats, via email. Alternatively, download them directly in Minium Manager.
To choose the formats to receive via email, go to the configurations of the project and expand the advanced configurations:
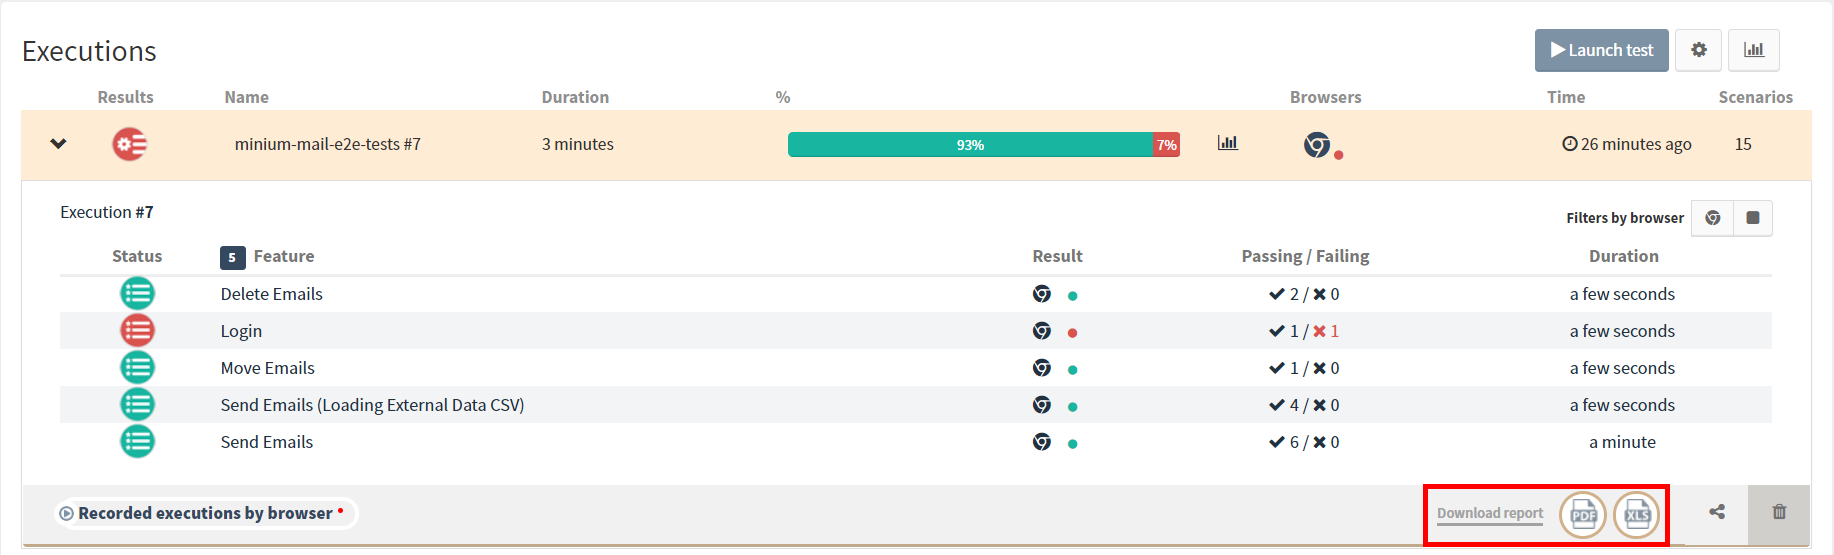
To download a report, expand the results of a test execution and click in Download report:
4.3. Daily Reports
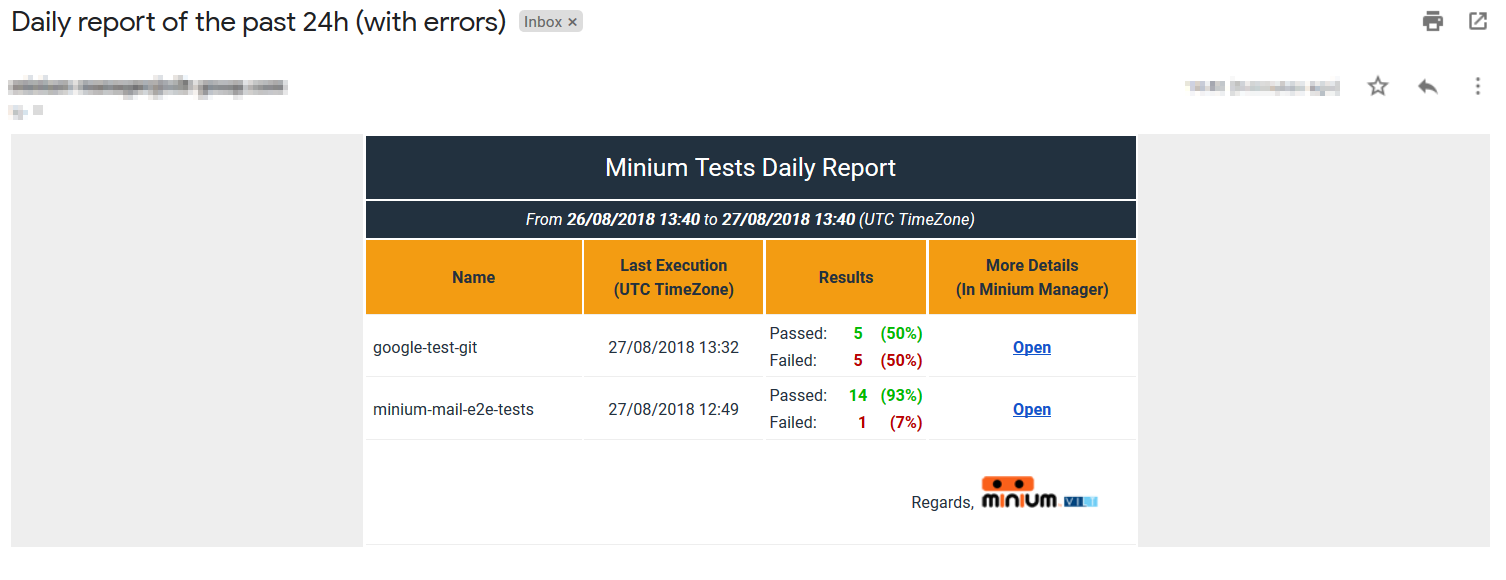
The daily report is a custom report with your favorite projects that will be sent to your email with the status of the last completed execution in the last 24 hours.
Before being able to configure a daily report, first you need to set the email configured at Account > Settings.
|
Note:
If Minium Manager is using LDAP, please contact your administrator to set your email at LDAP. |
To create a daily report configuration, open the Account menu and click on Daily Reports.
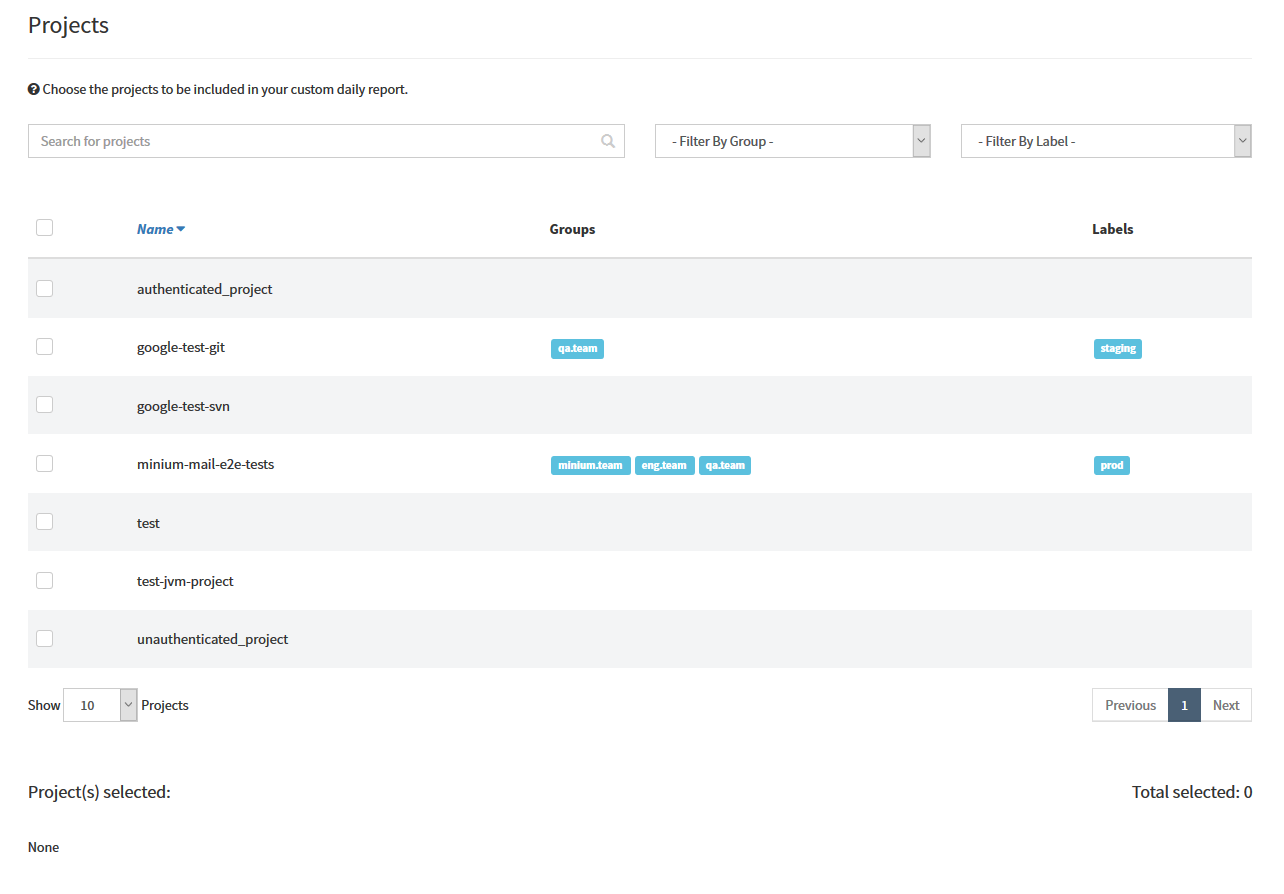
Choose the projects to be included in your custom daily report:
After, schedule the time the email will be sent, with a summary of the past 24h.

Finally, click on the button "Create/Update Daily Report Configuration" to create/update the daily reports:
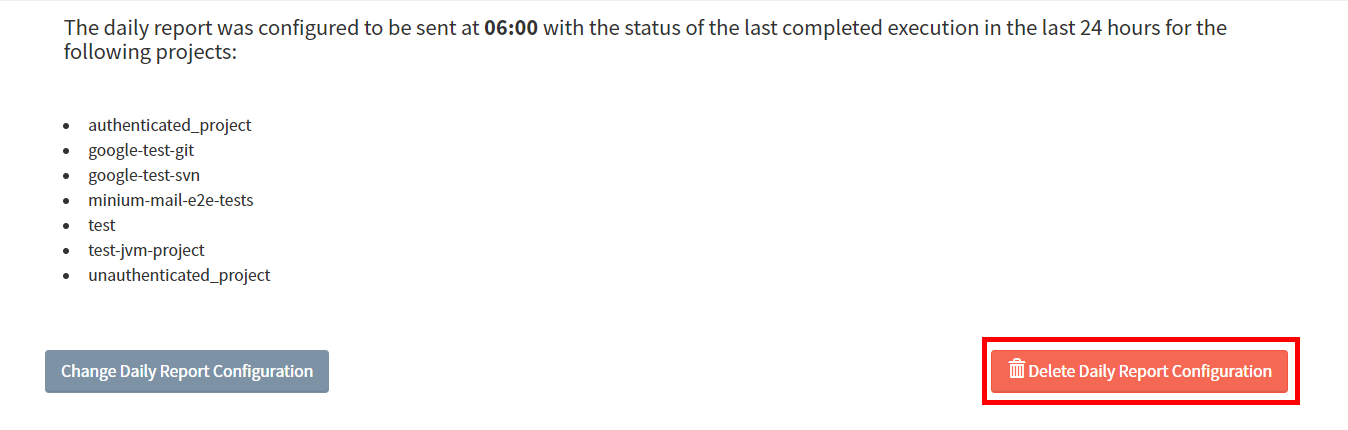
To delete the configuration, click on the button "Delete Daily Report Configuration".
4.4. Data Extraction Reports
The Data extraction report is a custom report (in Excel format) with your favorite projects that will be sent to the specified email addresses with the status of the last completed execution, and the project details.
To create and/or consult the data extraction reports configurations, open the Management menu and click on Data Extraction Report.
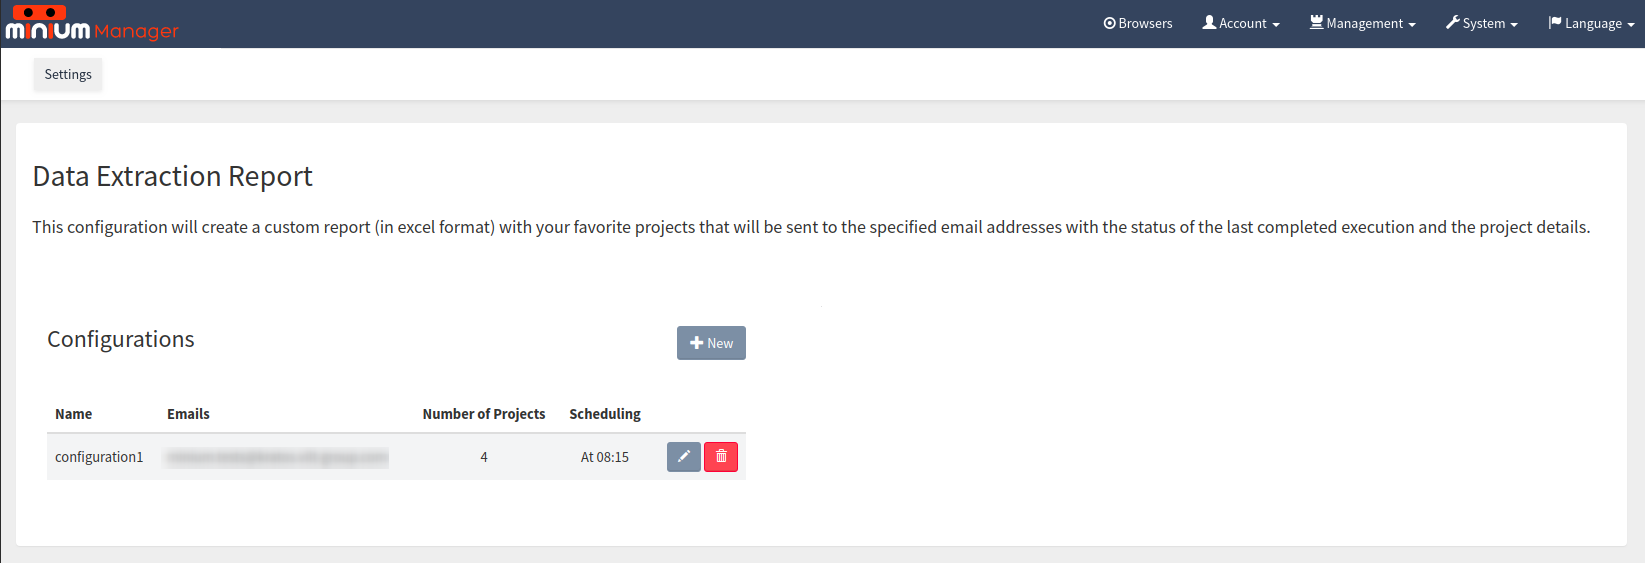
At the data extraction report page, you can see the current configurations created at the list Configurations.
You can edit (by clicking in the pencil button) or delete (by clicking on the trash button) the configurations listed at the list Configurations.
Also, you can create a new configuration by clicking on the button + New.
When you click the button + New, a form will appear (similar to the edit form) on the right side of the page:
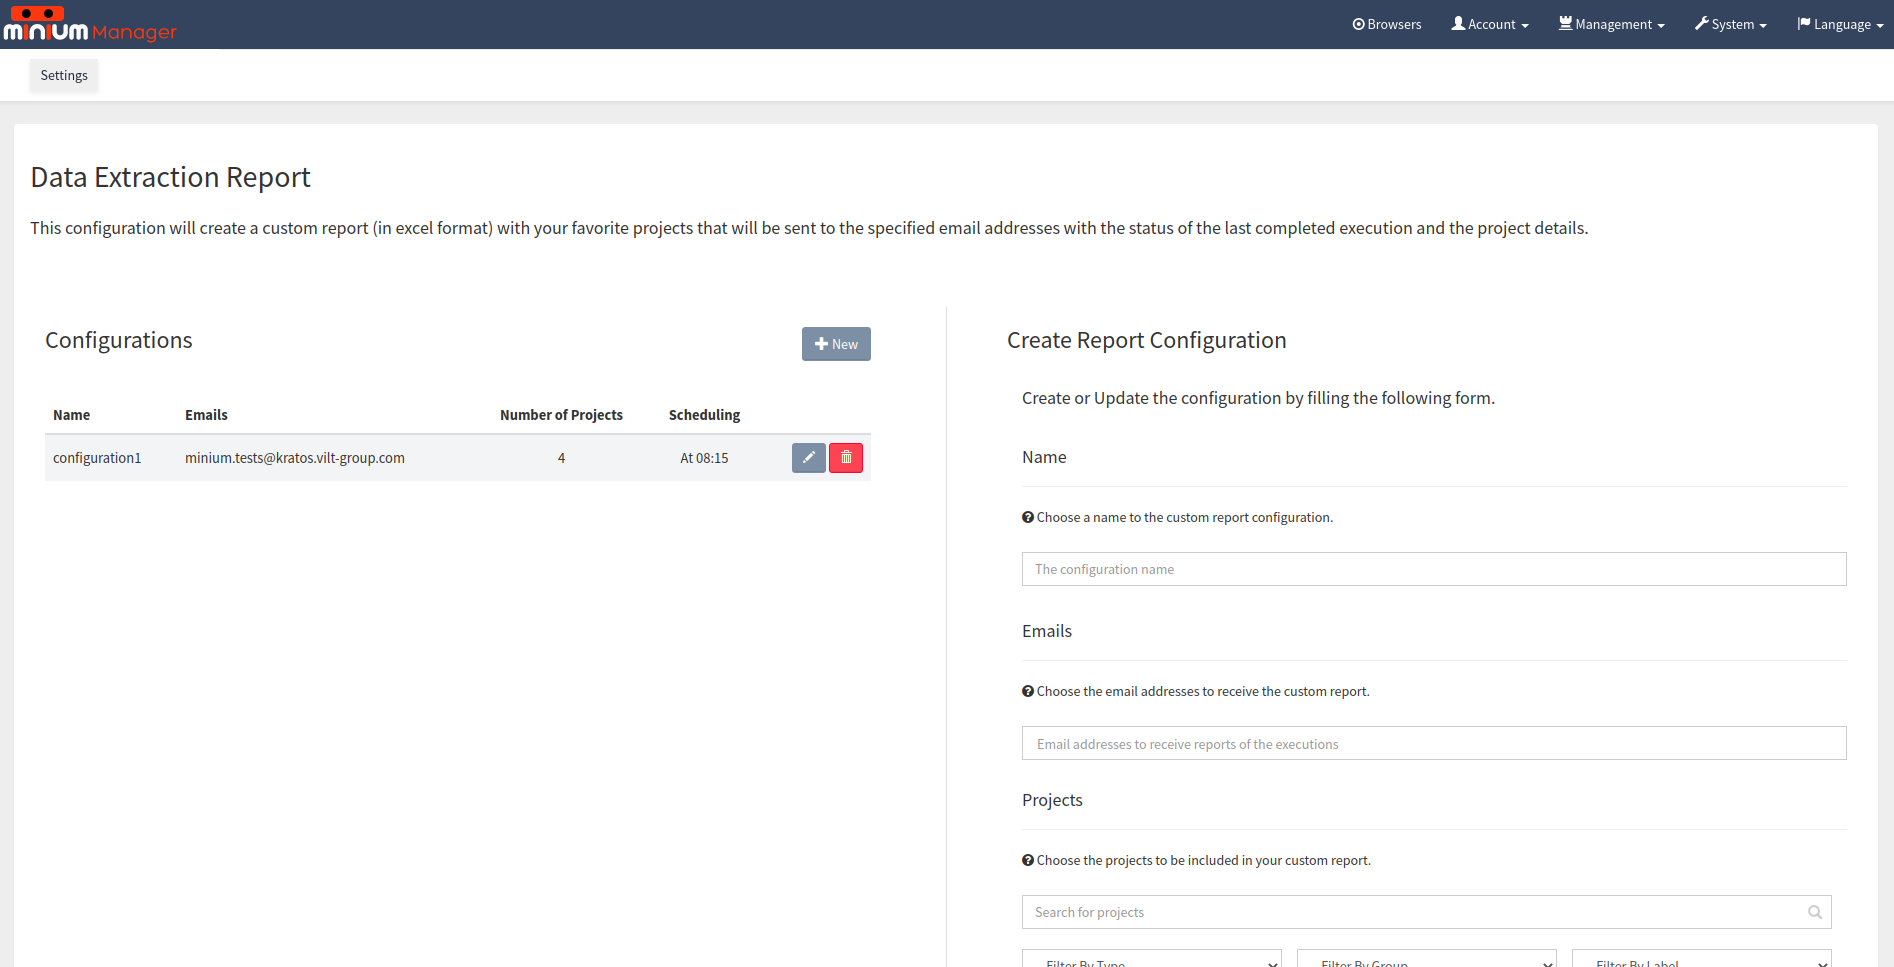
To create a new configuration, fill the form by add a new configuration name (unique value), the emails that will receive the configuration, choose the projects to be included in the report and finally, schedule the time the email will be sent, with the report.
|
Note:
To choose the projects, you have filters available to help. You can filter the project by name, type, group and label. |
To save the configuration, click on the button + Save.
The email received will list a summary of the projects selected (separated by type), the statistics of the monitoring projects (How many executions since last report was sent, how many executions passed and how many executions failed), and will have the report (in Excel format) attached.
|
Note:
The subject of the email received is "Data Extraction Report". |
4.4.1. Crawler Aggregator
The Data extraction report has an option to generate one report with only Cookie Crawler Projects.
To configure Data extraction report with the aggregation of the Cookie Crawler Projects, choose the type Crawler Aggregate:
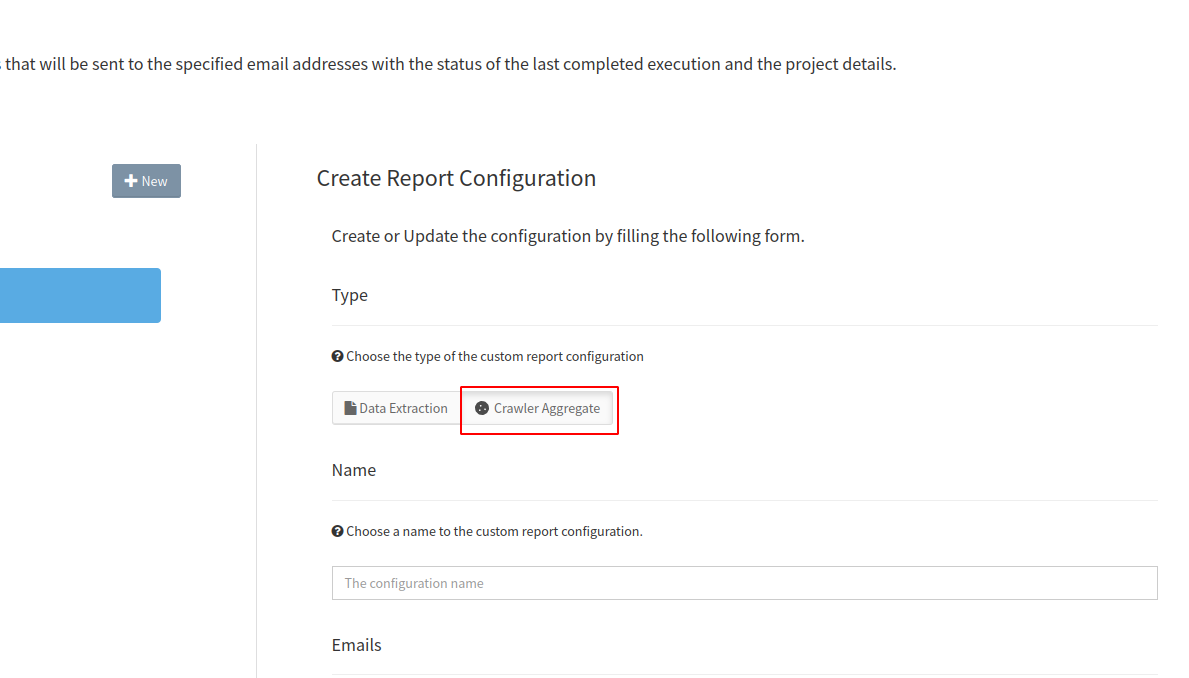
After configure the report as a Data extraction report.
The email received will list a summary of the projects Cookie Crawler selected, and the statistics of the projects (How many executions since last report was sent, how many executions passed and how many executions failed).
4.5. Regressions
Minium Manager identifies the scenarios and features that were passing and in the last execution failed:
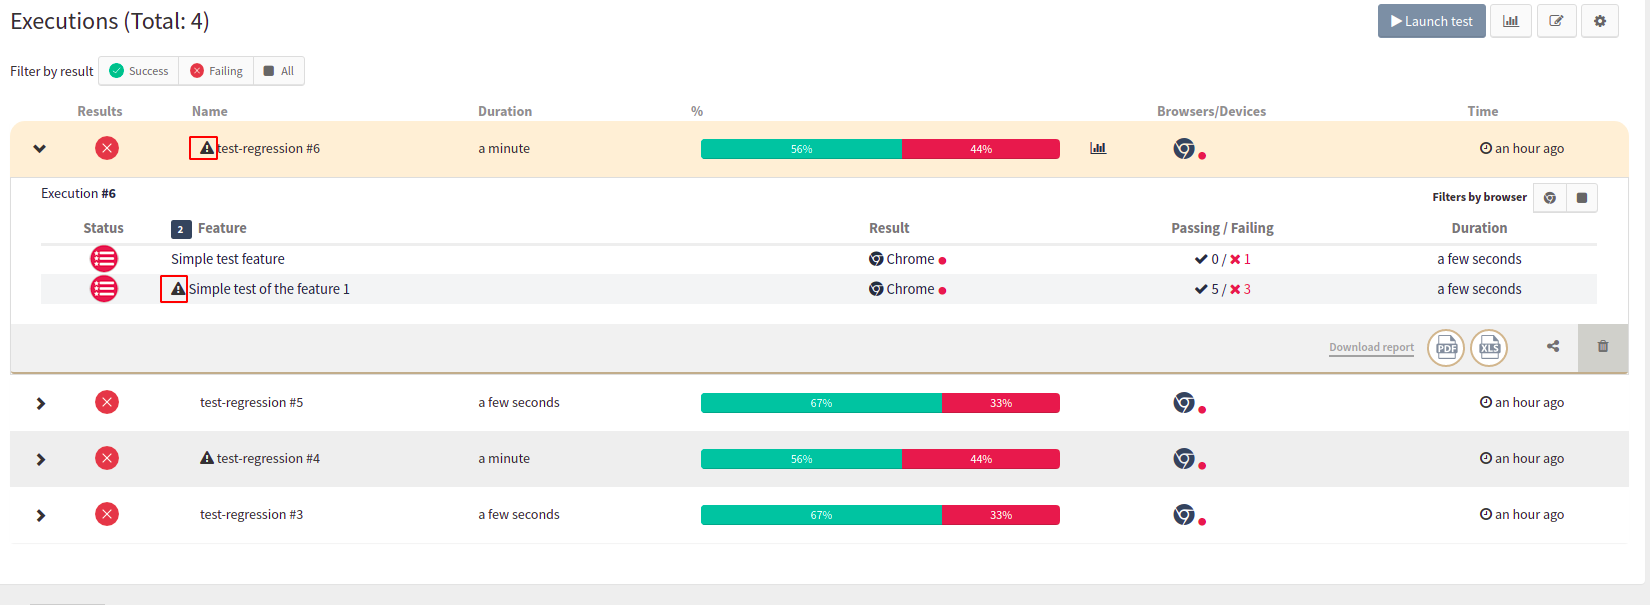
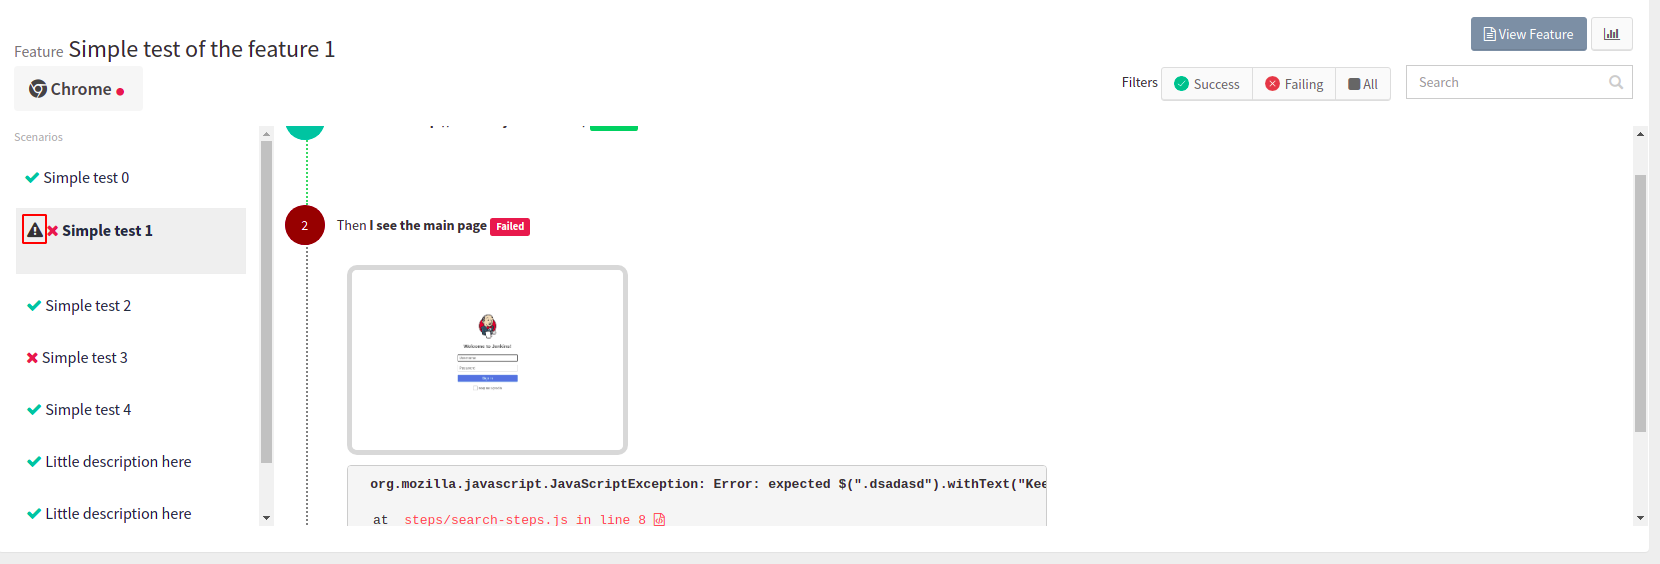
For monitoring projects, the executions page is:
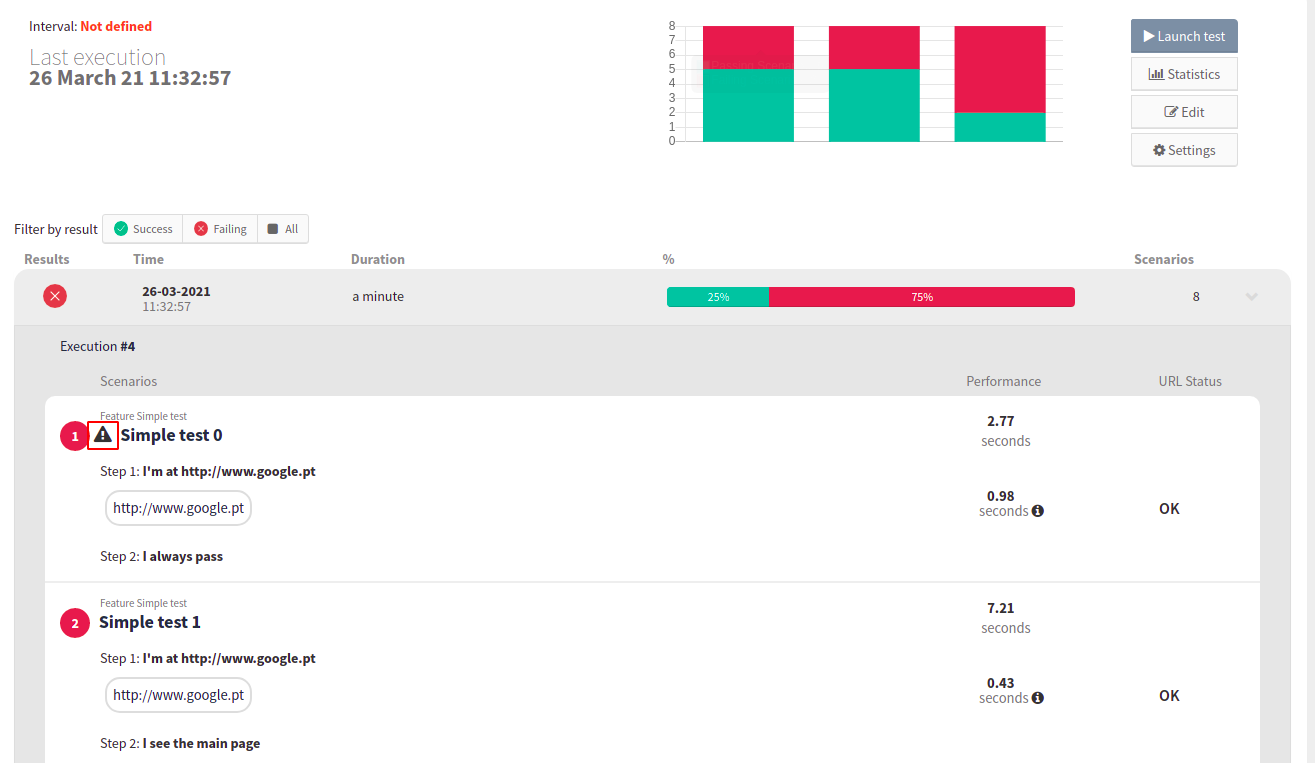
At the mouse over in the warning icon, the regressions’s widget is presented to show more information about the past executions, the last execution passed, and the last execution failed for the regression:
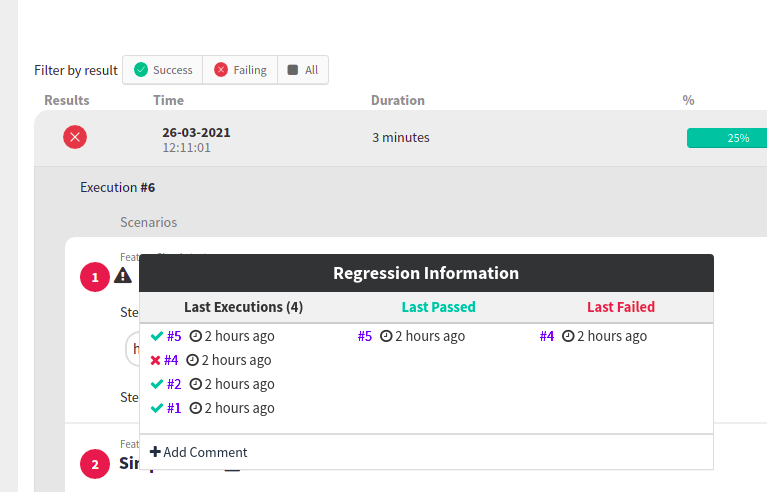
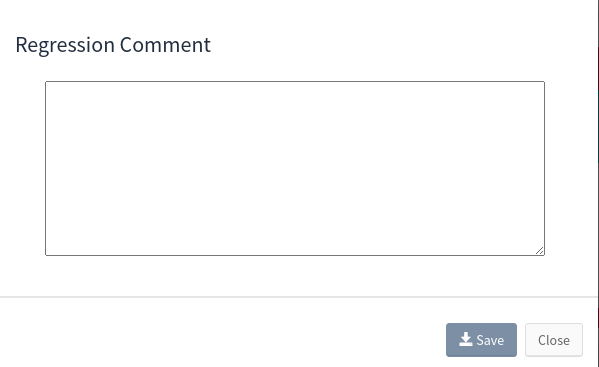
The regression widget also allow adding comments at the regression detected. To add a comment, click ad + Add Comment and fill textarea and click Save:
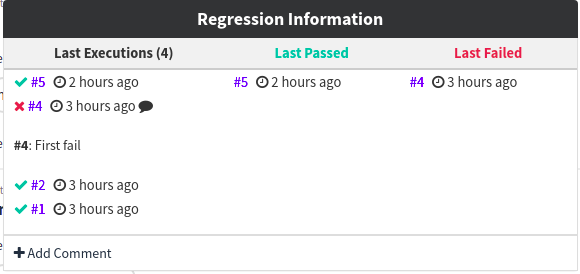
After, we can check the comments added in the previous executions by clicking on the comment’s icon:
We can also edit the comment by clicking on Edit Comment:
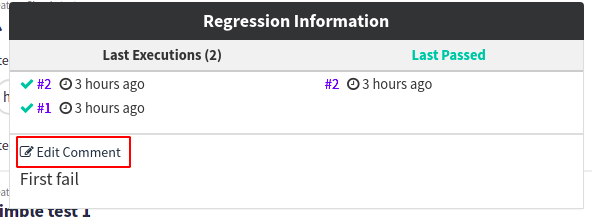
Edit the text and click Save.
To delete the comment click `Delete.
5. Roles
Roles allow granting different privileges to the users and the groups. The privileges associated with each role are described in the table below:
| User | Manager | Administrator | |
|---|---|---|---|
View projects |
|||
Launch test executions |
|||
Configure projects |
|||
Create projects |
|||
Manage project labels |
|||
Manage users |
|||
Manage roles |
5.1. Assign roles
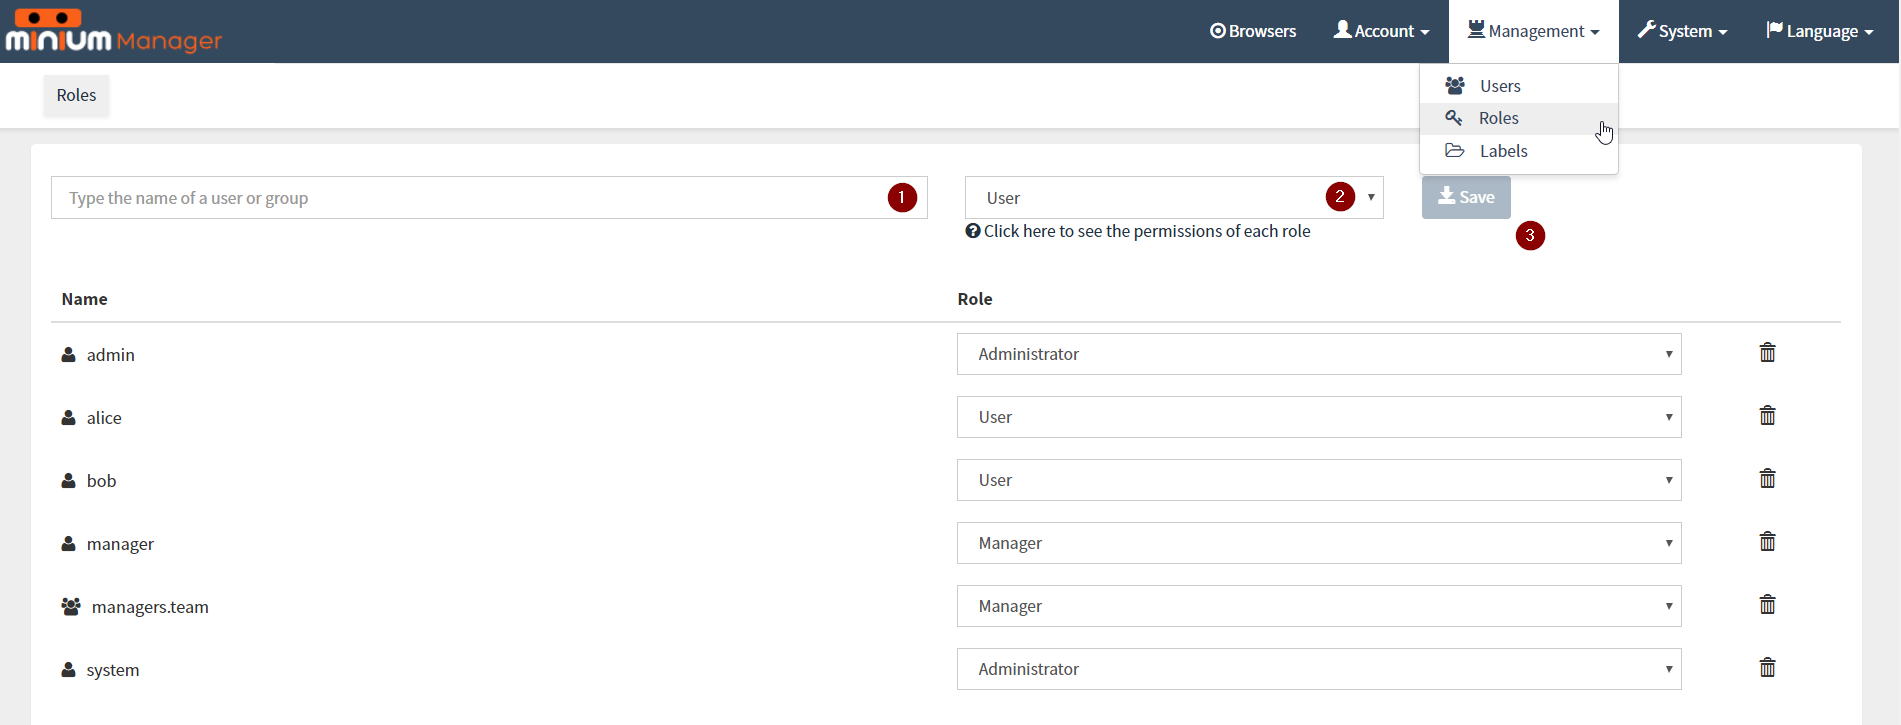
To change the role of a user or group, navigate to Management > Roles at the navigation bar and:
-
Introduce the name of the user or group in the search bar.
-
Select a role.
-
Click on
Savebutton.
6. License information
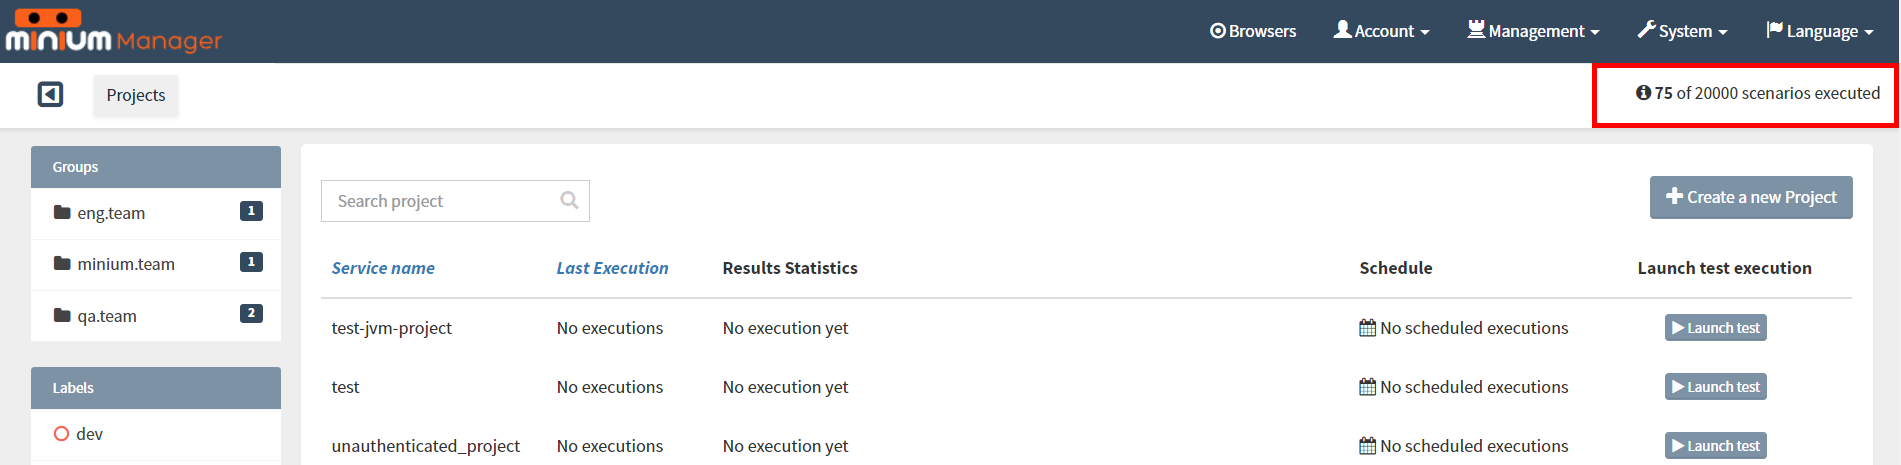
At the top right of the project list page exists the license information label, that gives the number of executed scenarios in this month, and the total of scenarios per month that to the current license
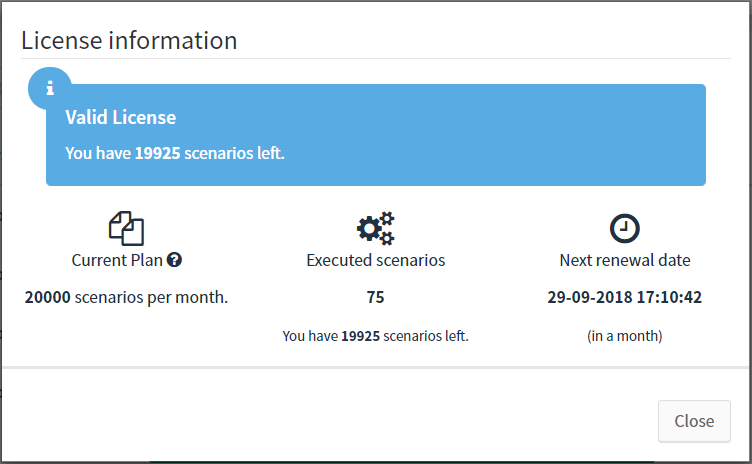
By clicking on the license information label, it will open a modal with more detailed information about one license.
7. Minium Recorder User Guide
Minium Recorder has been developed to ease and accelerate the creation of Minium tests. With the Minium Recorder, is no longer needed to write all the code for the step definitions by hand. Simply tell to the Minium Recorder to start recording the interactions with the browser, perform the actions that correspond to the defined step and an automation script is immediately available in Minium Developer.
But what really makes Minium Recorder different in relation to other automation script recorders is that, for each element that interacts, Minium Recorder will not generate just one CSS selector. Instead, is possible choose among a list of alternative expressions for each element that take advantage of the great Minium filtering methods that are used like for example withLabel, below, rightOf, etc, to build more readable and resilient expressions.
7.1. Configure Minium Developer
Minium Recorder is already configured at Minium Developer Prime, but you can configure an existing Minium Recorder.
To configure Minium Developer with the Minium Recorder extension, first you need to download the Minium Recorder extension.
Navigate to the folder where Minium Developer is installed, create a folder named "extensions", copy the Minium Recorder extension file to the new folder and rename the file to "minium-recorder.crx".
After, edit the config/application-{windows,linux,macos}.yml file in order to add the following configuration (at the chrome webdriver):
minium:
  developer:
    webdrivers:
      - name: chrome
        ...
        chromeOptions:
          extensions:
            - ${app.home:.}/extensions/minium-recorder.crx
          preferences:
            devtools:
              preferences:
                panel-tabOrder: "{\"chrome-extension://ggefeclafoeoejognlebilidgmgdglogMiniumRecorder\":10,\"elements\":20,\"console\":30,\"sources\":40,\"network\":50,\"timeline\":60,\"heap_profiler\":70,\"resources\":80,\"security\":90,\"audits\":100}"
7.2. Launch Minium Recorder
Launch Minium Recorder through Minium Developer.
Open Minium Developer and add the following command to the editor:
browser.get("http://www.google.com/ncr")This will load the google search engine website, when the instance of Chrome is launched.
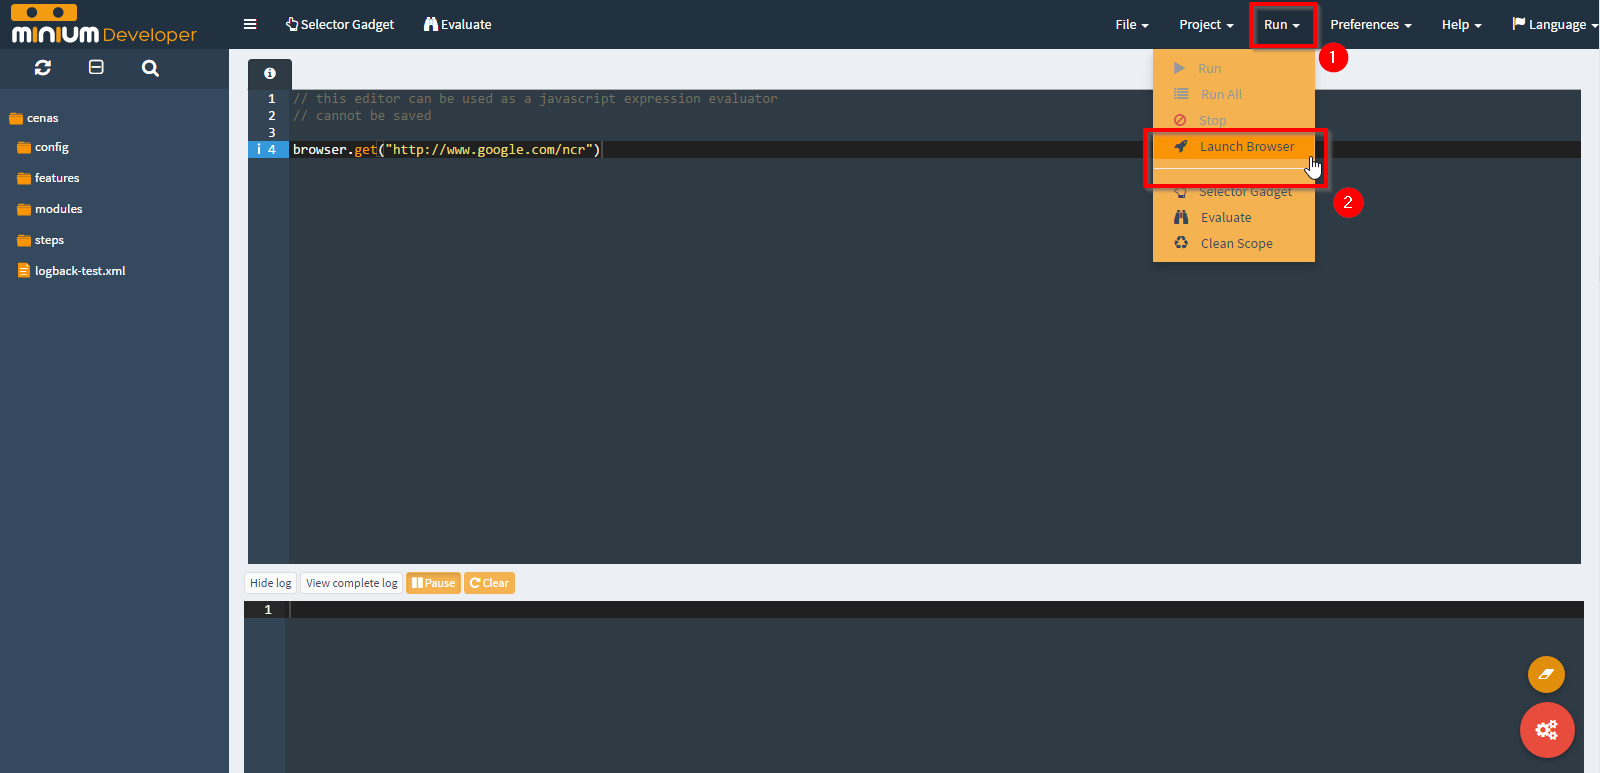
To launch Minium Recorder, use the (Ctrl + Enter) shortcut or select Run > Launch Browser (1) and (2) at the top-right menu:
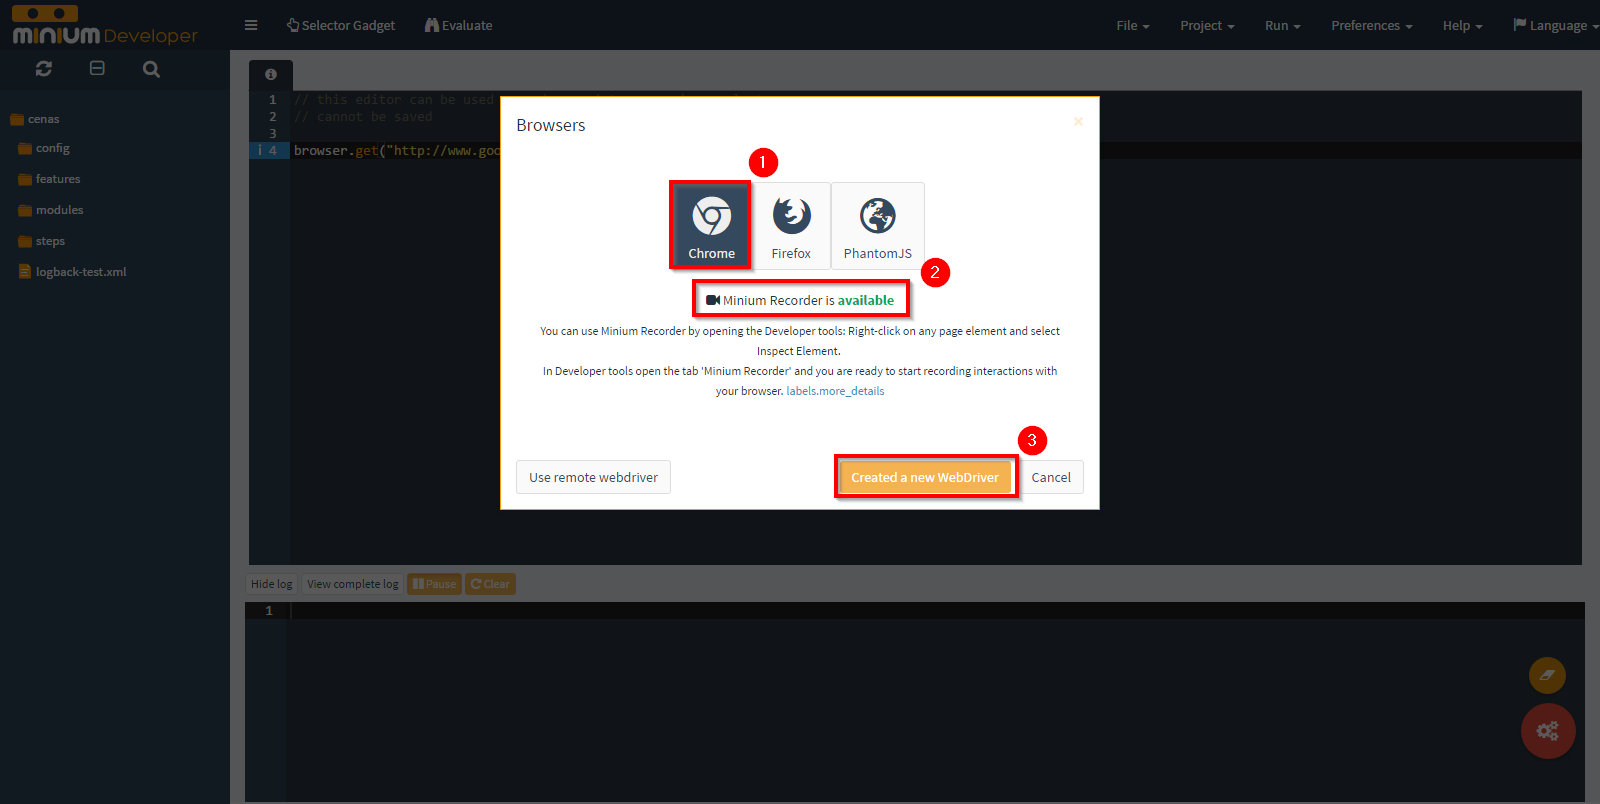
Select the Chrome browser (1), check if Minium Recorder is available (2) and click Created a new WebDriver (3):
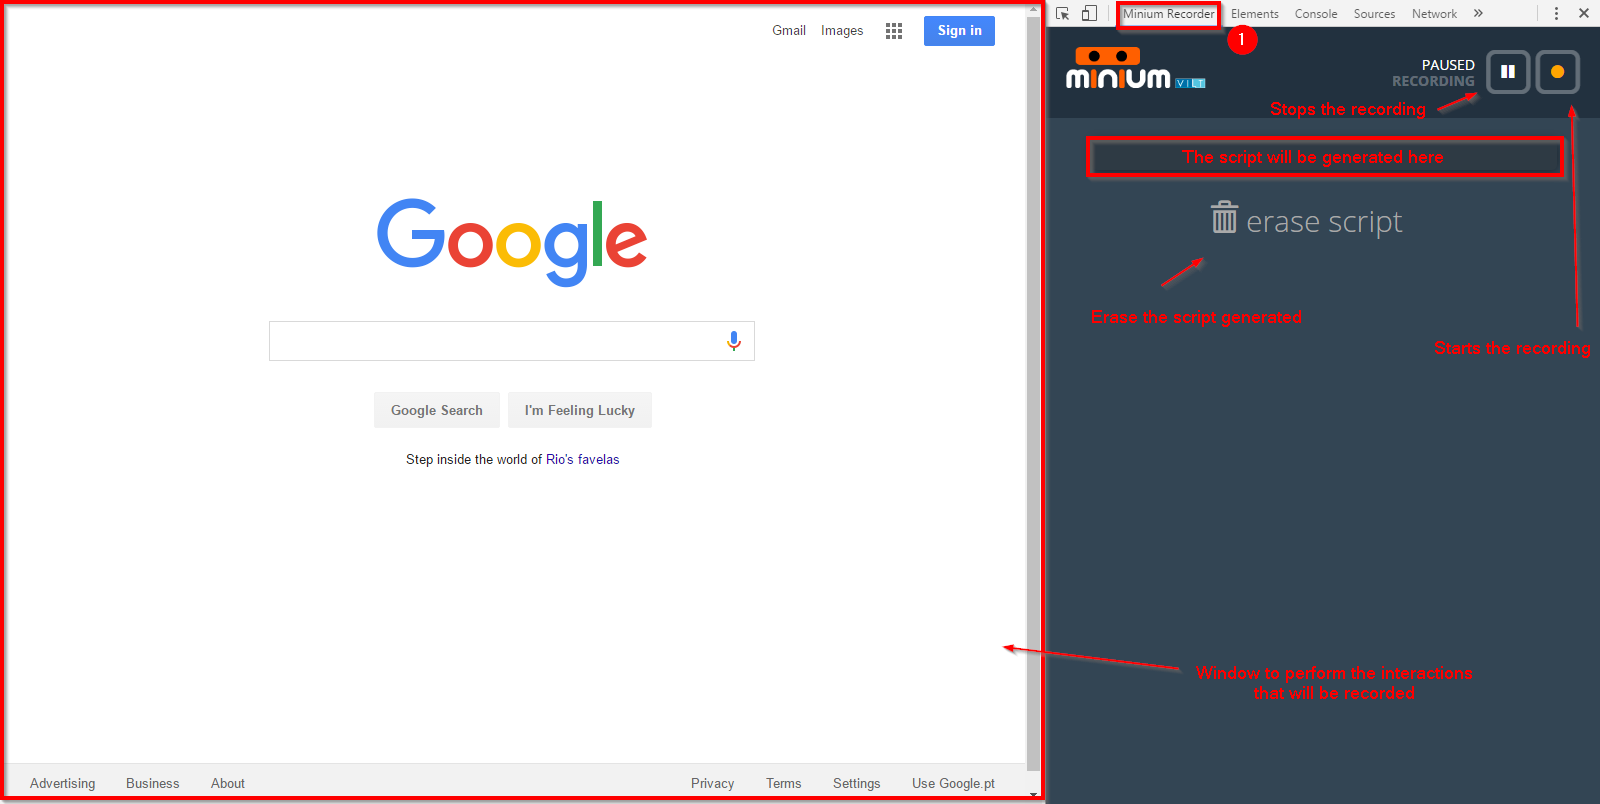
A new instance of Chrome will be launched with the Minium Recorder extension installed. In the instance of Chrome, open the Developer tools by using the (F12) shortcut (use another shortcut) or select More Tools > Developer tools.
After the Developer tools of the instance Chrome is opened, select the Minium Recorder tab (1):
7.3. Start recording
To start recording, click on the following button:
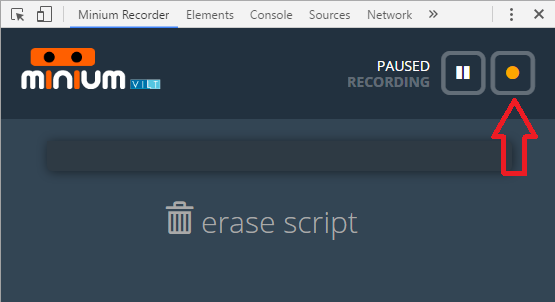
From now on, every interaction performed with the browser will be recorded.
7.4. Record interactions
For every action performed on the browser, like clicking on an element or filling a text input field, Minium Recorder will automatically generate the corresponding code. If typed an URL in the address bar, Minium Recorder will also generate the code to load that URL.
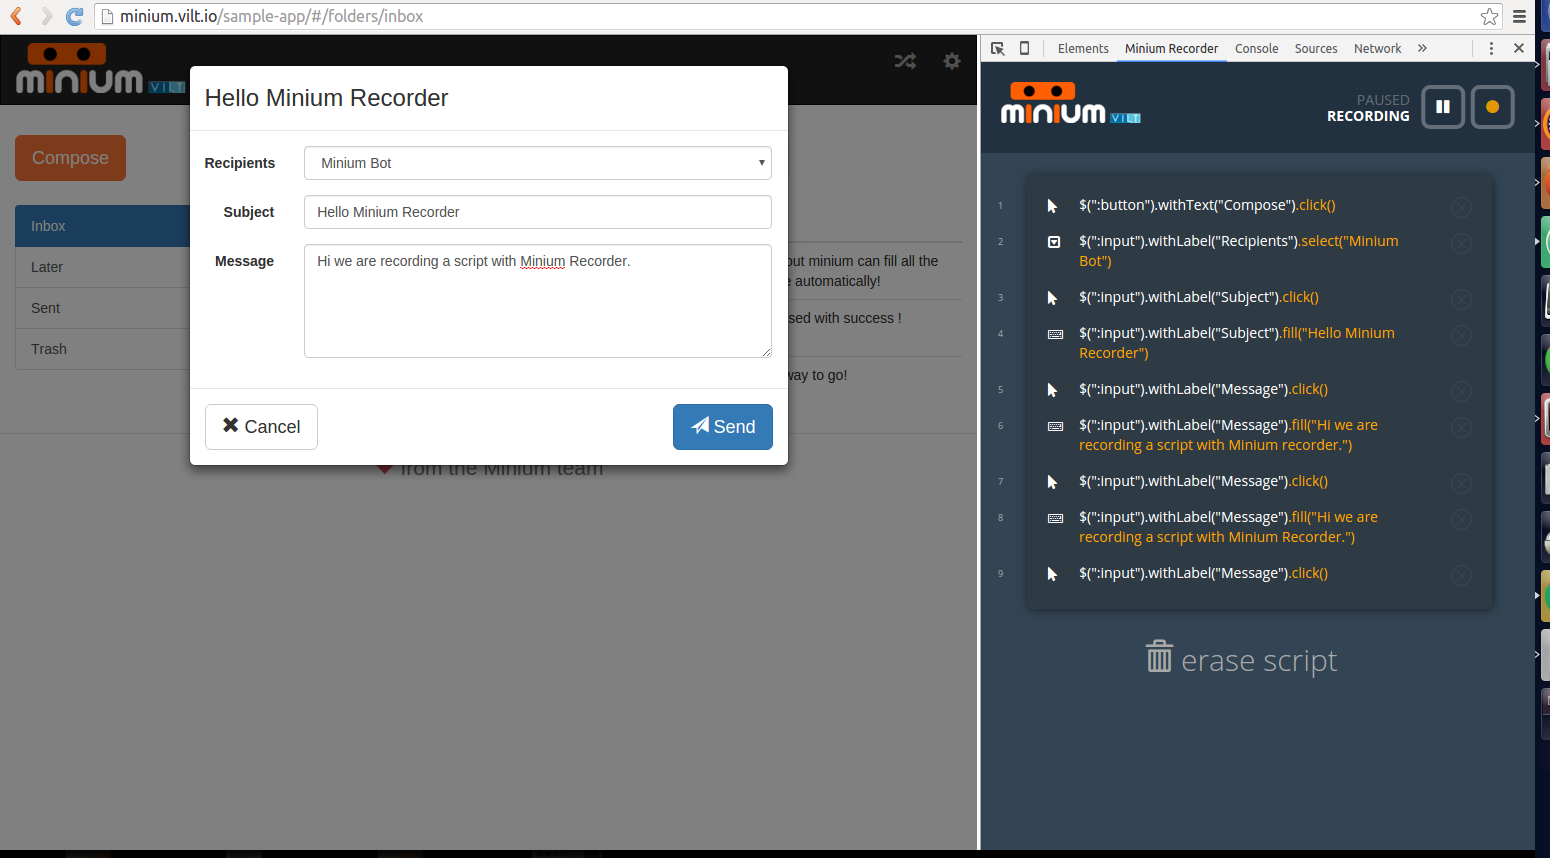
To try other expressions, click on the expression and a list of alternative expressions will be displayed:
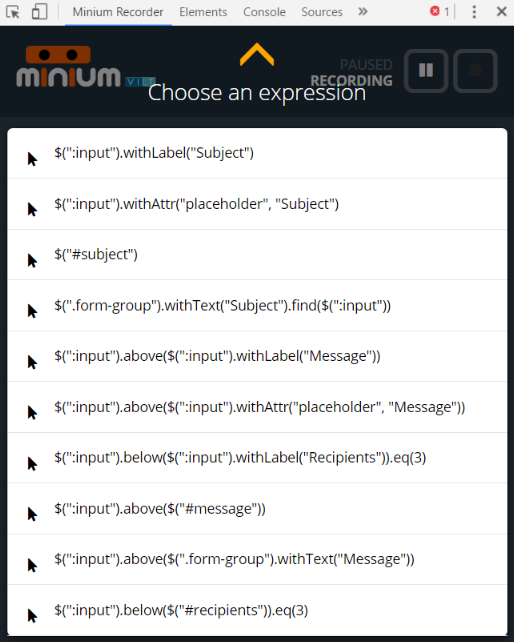
To select an expression, just click on it.
7.5. Stop recording
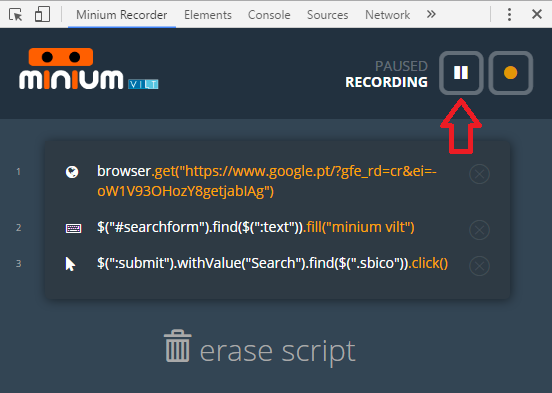
Click on the pause button to stop a recording.
7.6. Import the recorded script in Minium Developer
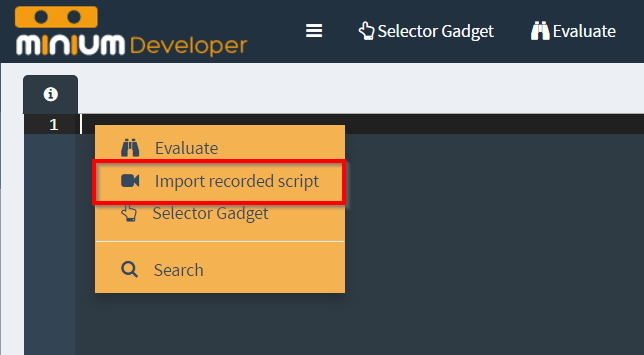
To import a script in Minium Developer, right-click on the editor area, where is intended to put the script, and choose the option Import recorded script: