Fuse Management Central 1.1
19-08-2020
VILT Group, S.A.
Rua Ivone Silva, 6 - 7º Esq
1050-124 Lisboa
Portugal
Tel: +351 210 343 399
info@vilt-group.com
For more information, visit http://www.vilt-group.com
Disclaimer
No Warranties and Limitation of Liability
Every effort has been made to ensure the accuracy of the features and techniques presented in this publication. However, VILT Group, S.A. and its affiliates accept no responsibility and offer no warranty whether expressed or implied, for the accuracy
of this publication.
1. Introduction
This user guide provides information about features and functionality of Fuse Management Central 1.1.
2. Document Revision History
| Revision Number | Modification Date | Section Modified | Modifications |
|---|---|---|---|
1.0 |
2020-08-19 |
All |
Initial version |
3. Supported Systems and Compatibility
Please refer to the Release Notes document for a complete listing of supported systems and compatibility.
3.1. Supported Screen Resolution
Fuse Management Central web application requires you to have your screen resolution set at a minimum of 1280x720.
(Windows Only) To verify your screen resolution settings, please do the following:
-
Go to Start.
-
Select Settings.
-
Select System.
-
Click Advanced Display Settings.
-
Check your Resolution.
-
If your screen resolution is below the recommended settings, click the arrow to toggle the drop down, and select a higher resolution.
-
Click Apply.
4. Get Started
4.1. What is Fuse Management Central?
Fuse Management Central is an application management platform that simplifies OpenText ™ Content Server® management and accelerates its administration learning curve. The Fuse Management Central web administration console enables centralized management of Content Suite instances as well as its component monitoring.
Fuse Management Central also separates system administration from content administration, introducing a new layer of security on top of the traditional OpenText ™ Content Server® administration tools.
4.2. Install Fuse Management Client
-
Extract Fuse Management Client ZIP file (
Clients/Fuse Management Client for OpenText Content Server 16.2/fuseclient_16_2_0.zip) outside of the OpenText ™ Content Server® installation folder. -
Copy the extracted
fuseclient_16_2_0folder to the<Content Server home>/stagingdirectory.If you are installing Fuse Management Client on a UNIX/Linux system, make sure that you are performing the setup actions with the user who installed OpenText ™ Content Server® and runs the Content Server service. -
Open Content Server Administration page in a Web browser.
-
If prompted, enter the Administrator password, and then click Log-in.
-
Select:
-
(OpenText ™ Content Server 16.2.5 and below) Module Administration > Install Modules
-
(OpenText ™ Content Server 16.2.6 and above) Core System > Module Configuration > Install Modules
-
-
From the Installable Modules list, install Fuse Management Client module.
-
After the installation of Fuse Management Client module is completed, restart Content Server.
For some Content Server versions, specially earlier ones, we found out that the standard soft-restart is not enough to reload all the loaders required for Fuse Management Client, so we suggest you do a second hard-restart to make sure everything was updated. Please check the troubleshooting section.
4.3. Add New System
This section will guide you through the process of adding a new system (OpenText ™ Content Server® instance) to Fuse Management Central.
Before starting, ensure that:
 You have the Fuse Management Client module installed on your system (OpenText ™ Content Server instance)
Fuse Management Central can access your system (e.g. http(s)://otcs.company.com/otcs/cs.exe)
Your system can access Fuse Management Central (e.g. http://fuse.company.com:2100)
| The first time a system is added to Fuse Management Central, it cannot be running under Eclipse (CSIDE). Is mandatory to wait until Fuse Management Central scans all of your system’s component. |
4.3.1. Activation Request
-
Access Fuse Management Central:
http://<fuse-management-central-host>:2100 -
Login with your authentication credentials:
-
Username:
fuseadmin(default) -
Password:
fuseadmin(default)
-
-
Click Systems on the navigation menu
-
Click Add System
-
Fill the following fields, following all wizard steps:
Field Description Environment
Environment name (e.g. "DEVELOPMENT")
Please note that only systems belonging to the same cluster can be added to the same environment. Mixing systems from different clusters on the same Fuse Management Central enviroment will cause system deactivation!System Name
System name or alias (e.g. "LV181")
System Type
Default: OpenText Content Server
System URL
System CGI path (e.g.
http://otcs.company/otcs/cs.exe)Username
User account with system login privileges (e.g. "otadmin@otds.admin")
Password
User account password
Advanced Options
(Optional) Description
System description to help system identification (e.g. "Partner sandbox")
(Optional) Owners
System owner(s) email(s) (e.g. "john.doe@company.com"), for event email notifications
(Optional) Tags
System tags (e.g. "front-end")
System tags can be very useful when logically grouping systems, allowing you to filter them when, e.g. applying configurations, performing bulk actions, … -
Click Test Connection to validate that your system fulfills all requirements
If connection test is not successful, please review all system parameters (System URL, credentials, …) and try again. -
Click Finish
-
Next, copy System ID and send it to your system administrator to authorize Fuse Management Central activation request
4.3.2. Authorize Activation
-
Open the Content Server Administration page in a Web browser.
-
If prompted, enter the Administrator password, and then click Log-in.
-
Select Fuse System Administration > Fuse System Activation.
-
Insert the provided System ID and click Activate
-
Your system is now activated and Fuse Management Central can start manage and monitoring it
| If the authorize activation process fails, please check if all requirements are fulfilled and review the procedure. |
5. How to Use Fuse Management Central
Fuse Management Central is organized into 6 different areas, each one covering an operational role and suited to provide different perspectives over your OpenText CSP infrastructure.
Each area is designed to offer an optimized user experience in systems management, while maintaining close control and monitoring features.
5.1. Errors & Alerts
Fuse Management Central provides resourceful alerts as UI indicators and email notifications so you can have a bigger control on what it’s
going on with the systems.
The alerts are divided into three categories:
-
Errors → Indicates a problem ocurring.
-
Warnings → Warns about possible problems about to occur.
-
Resolved → Represents a previous alert that has been resolved.
Alerts are triggered when they reach a defined threshold.
| Admin users can redefine some of the thresholds for the alerts. You can read more about this in the [bookmark-administration-alerts] chapter. |
5.1.1. UI Indicators
Fuse Management Central allows you to quickly identify problems in the OpenText ™ Content Servers® components and processes using visual indicators.
These visual indicators are easy to identify and are spread all over the application trough dashboards and widgets.
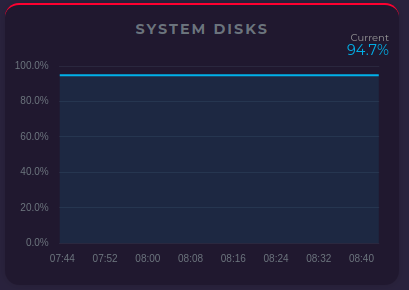
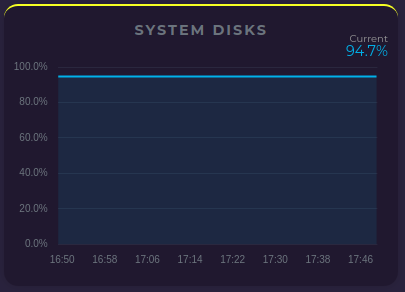
Charts indicators are shown as a blinking bar over the widget.
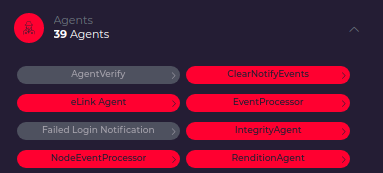
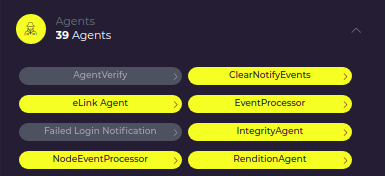
Components and processes color is changed according to the alert level.
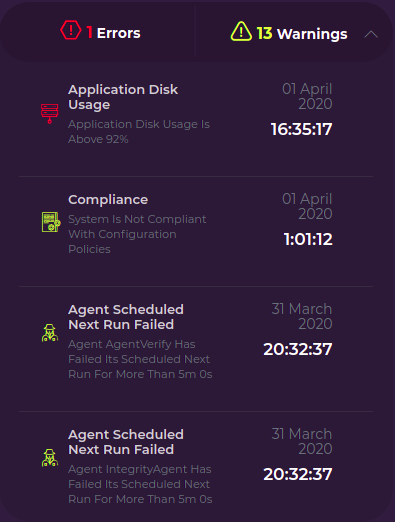
Errors and alerts counters can be expanded in some dashboards, usually the more detailed ones (for instance, a System Dashboard). When expanded it will show the list of all related alerts with more detail. It is possible to highlight the widget related with the alert, to do that just hover the mouse over the alert on the alerts list.
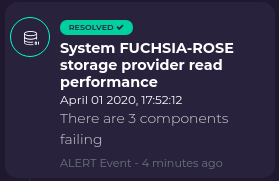
Resolved states are only listed in the events bar when the alert stops being triggered.
5.1.2. Alert email notifications
Fuse Management Central can send email notifications for every alert that is triggered. Those emails are sent to all owners of the corresponding systems and / or environments, and will include useful information regarding the type of alert, its severity and observed value.
Alerts notifications can include more than one alert, if they have the exact same type, system and / or environments, date and severity. That means that if two agents that belong to a specific system trigger the exact same alert at the same time, only an email is sent that aggregates those two alerts.
Configure email address
To get email notifications from a specific system, you must:
-
Edit the system to get notifications from
-
Expand Show Advanced Options
-
Add your email address to Owners
-
Save the system
To get email notifications from an environment, you must:
-
Edit the environment to get notifications from
-
Expand Show Advanced Options
-
Add your email address to Owners
-
Save the environment
| If you want to receive notifications for all systems in an environment, you just need to configure notifications in that environment, because it will automatically include all systems |
Inhibited alerts
There are two situations that inhibit alert notifications, meaning that you won’t get those notifications even if the alert is actually active:
-
when system is offline, all other alerts regarding that system are inhibited
-
when there is an error alert and a warning alert with the same type for the exact same component, system or environent, the warning event is also inhibited (e.g. if CPU above 80% triggers a warning event, and CPU above 90% triggers a warning event then only the error alert notification will be sent when CPU is above 90%)
Email content
In the email subject, we include the following information:
-
Whether the alert was triggered (
[ALERT]) or was resolved ([RESOLVED]) -
If the notification aggregates more than one alert, it displays
[ALERT DIGEST]instead of[ALERT] -
If alert was triggered, it also includes its severity (either
WARNING |orERROR |) -
finally, the alert title, specifing which system or environment was affected, is included
An example of the email subject is:
[ALERT DIGEST] WARNING | System OTCS-01 agent scheduled next run failedFor the email body, the following information is included:
| Field | Description |
|---|---|
Severity |
Alert severity (Warning, Error, or Resolved) |
Title |
A simple title specifing which system or environment was affected |
Summary |
A more detailed description of the problem, which can include the component name that triggered that alert |
Start Time |
When the alert was triggered |
Affected |
Includes a reference to the environment and system where the alert was triggered |
Metric |
The internal alert name |
Treshold |
The threshold value that was configured at the time the alert was triggered |
Observed |
The actual value that was observed when the alert was triggered |
| For aggregated alert email notifications, a list with the description and the observed value for each individual alert is also included. |
5.2. Events
Certain operations in Fuse Management Central trigger events, which are registered in the system and are then available for consultation.
These events are divided into two types: Audit events and Alert events.
5.2.1. Audit Events
Currently, an audit event is created every time a user created, updates or deletes the following entities:
-
Systems
-
Environments
-
Configuration Policies
-
Fuse configurations
-
Scheduling jobs
These events can be used to determine who, when and what changed in Fuse Management Central for auditing purposes.
5.2.2. Alert Events
Alert events are triggered by alerts from Alert Manager, and they basically store when the alert was triggered and its status (either it has been resolved or not).
Alert events are grouped by alert type, system / environment and time, which means that if more than one component triggers the same alert type for the same system / environment, they will be stored in the same event.
| Some alert types are by environment only, they are not associated with a specific system (e.g. alerts related with System Object Volumes). |
5.2.3. Severity
The following table describes event severity types:
| Severity | Description |
|---|---|
Error |
events triggered by error alerts |
Warning |
events triggered by warning alerts |
Info |
audit events or on events triggered by resolved alerts |
| Error and Warning severity directly corresponds to the actual event severity when that event is not resolved yet. |
5.2.4. Events List
To list all events:
-
Login in to Fuse Management Central
-
Click on the rightmost icon in the top navigation bar
-
All events will be displayed, ordered by descending date
It’s then possible to apply filters and scroll down results to keep getting previous events.
Relevant information regarding each event is displayed:
-
title
-
description
-
date of the event
-
a red, yellow or green color, indicating an error, warning or info event, correspondingly
-
the event type
-
the event performer, on Audit events
-
in case of a resolved alert event, a RESOLVED badge is shown
Filters
When listing events, the user can apply filtering criteria. For that, the user must expand the Filters section at the top of the events list, and all filter options will be available there.
The following table describes each filtering criteria available:
| Filter | Description |
|---|---|
Full-Text Search |
Filter operations by typing a combination any of the search parameter(s): Name, Summary, and/or Performer |
System |
Filter by system that triggered the event |
Environment |
Filter by environment where event was triggered |
Severity |
Filter by event severity (Info, Warning or Error) |
Event Type |
Filter by combining operation type (Audit or Alert) |
Date Interval |
Filter by range of execution dates |
5.2.5. Retention policy
Events retention policy is 15 days. Events before that period are permanently deleted from Fuse Management Central.
5.3. Systems
Systems are the key element to Fuse Management Central, as all metrics and operations are retrieved and applied to them, allowing a central management and monitoring approach.
Before adding a system to Fuse Management Central, you must first install Fuse Management Client module on OpenText ™ Content Server. Please refer to Install Fuse Management Client section for more details.
System components status begins automatically as soon as a system is activated in Fuse and starts autonomously sending metrics.
To access Systems area, click Systems on the navigation menu.
You will be presented with a systems dashboard which allow you to see individual and aggregated system status metric, such as:
-
Performance and Availability
-
Averages of Threads Usage, Queue Time, Queue Depth, CPU Usage and Memory Usage
-
Errors and Warnings
Administrators, can also add Environments and Systems clicking on the respective buttons at the top right corner of the page.
The table presents all the systems added to the Fuse Management Central. Each row represents an individual system where you can visualize its state, individual metrics and perform actions if the user as administration privileges. To perform an action just hover the mouse over the button under the Actions column to be presented with following options:
-
Activation Request: available only when the system is deactivated. This will send a request to the OpenText ™ Content Server® instance to active the system. (For more details check: Add New System)
-
Deactivate: this allows you to deactivate the system.
-
Edit: you can edit the system.
-
Restart: restart the system or scheduled the restart.
-
Generate System Report: generate a system report or schedule one.
It’s possible to apply an action to multiple systems at once. To do that, just select the systems you desired to perform the action at the table, move the mouse hover the Actions button (that will be enabled when systems are selected), and choose the desired operation to apply to them (some actions could be disabled based on the system status).
| Check more info on operations at Operations Chapter |
Clicking on each System name or its Environment name will lead you to the System Details or to the Environment Details page.
5.3.1. System Details
Once you enter a System you’ll be presented with a system dashboard where you can visualize
more detailed system information, individual metrics and system related actions.
Some of the information, regarding the system status (offline and CSIDE Mode), will have visual indicators so the user can easily identify the system status.
The widgets presented will be more detailed in the following topics.
5.3.2. Threads
Threads are parts of OpenText ™ Content Server process that allow it to perform multiple functions concurrently, serving several requests at the same time.
When a thread is spawned, it loads all of installed modules and patches, persisting their own OScript objects in memory.
Fuse Management Central allows to monitor in real time all system threads, allowing a constant and thorough analysis of all dimensions of thread metric data, effectively allowing you to profile your system.
Clicking on the double arrow to the top right of the widget will take you to the thread details page, increasing the level of detail of this component.
The Threads widget also allows you to quickly apply settings, by clicking the wrench icon on the top right of the widget.
Threads Details
This page allows you to have a more in depth information about each individual thread.
The same configurations displayed in the Threads widget can be changed here, by clicking the wrench icon on the top right of the page.
If a thread is generating a log file, it’s possible to quickly open the log by clicking the button under the Log File column. It will open a new tab displaying the log file with the Logs Viewer.
5.3.3. Processes
Processes show you the agents and the loaded processes within Content Server which are loaded.
You can enable or disable individual processes by clicking directly on them, displaying its full details, such as name, status, alerts, etc..
Whenever an administrator modify a process, the Apply Changes button becomes activated allowing to push those changes immediately, or schedule them, to be applied on your system.
5.3.4. Configurations
The Configurations widget allows the user to view how many configurations are applied to the system as well Configuration Polices and their compliance state.
To access a configuration policy just expand the Configuration Polices and click the policy desired.
To view the configurations with more detail click on the double arrow to the top right of the widget.
Configurations Details
You can see all the configuration settings for a given Content Server and have the ability to change them from this interface.
From here, administrators are able to change most aspects of the Content Server administration or reuse these configurations in a Configuration Policy.
Fuse Management Central recognize which configurations require a system restart, if so, a confirmation message will appear to alert the user.
To apply any configuration just expand the configuration desired change the value/toggle you want, the Apply Changes button will be enabled and you can click it to apply the changes.
To add configurations to a Configuration Policy or other Systems, select the desired configurations by clicking on the box on the left of the configuration (the box will show a check mark when selected). At this point, the Add Configuration Policy and Add to More Systems will be enabled and you can click the button to perform the desired action. After click the button, you will be allowed to choose the Configurations Policies or the Systems you want to apply, after choosing it just click the Add to Configuration Policy or Apply Configurations, according to the action selected.
| Changes cannot be applied and added to a Configuration Policy or other System at the same time. If you want to add any configuration change you need to apply it first. |
5.3.5. Storage Providers
Content Server storage providers are listed here and clicking on each provider will expand its details, displaying its read and write throughput and also providing an graphical representation over time of its performance.
5.3.6. Logs
Although Fuse Management Central does not require any logging enabled, it allows one to manage and view your system log files if desired.
The logs widget gives you an overview of your system logs, allowing you to see the number of log files being generated and if there are any trace files (exceptions) being generated.
Clicking the wrench icon will allow you to quickly change your different system log levels.
You can access the Log viewer by clicking the double arrow icon to the top right of the widget.
If a trace file exists, you can open it quickly just by expanding the trace files and clicking at the trace file. When clicked, a new tab will be opened with the trace file displayed on the Logs Viewer.
Logs Viewer
The Log Viewer allows you to browse and visualize any of your system logs, as well as searching for a specific word(s) inside the log opened in the viewer.
|
You can access the Log viewer by clicking a log file on any Fuse Management Central component area. |
Log files are shown at the tree view structure where users can navigate and click the log file to visualise it’s content and
select files or folders to download or perform actions. You can sort the tree by name, size or last modification date. You can also search the tree for log names.
When visualizing a log file some reserved words will highlight its line position, helping one to quickly identify any occurred issues:
-
WARN → Yellow
-
ERROR → Red
The footer shows the number of lines as well as counters for warning and errors in the loaded lines.
Next to it it’s a button to maximize or minimize the viewer.
If the number of lines displayed is less than the total lines, more lines will be loaded as you scroll up the log file.
When the log file is updated, a button will be shown informing the user the new number of lines that he can loaded clicking the button (there’s also a blue circle indicator showing next to the tab file name). The user can activate the "Auto Refresh" toggle in order to automatically load new lines. New lines will be loaded and marked as new with a separator
in the viewer.
Users can search for content inside the opened log file using the search bar in the header of the log viewer.
Fuse Management Central log viewer also allows you to have different log files opened at the same time and navigate through them by a tab system. To close a tab, just click the X button next to the file name.
For trace files, the user has the possibility to view the file with a trace view layout or plain text. A toggle button to switch the view type will be shown on the bottom left corner of the viewer.
| Either in the Log browser or viewer, whenever a log file is updated on your system a blue circle will be displayed near its filename. |
System administrators can download/delete one, multiple or an entire log folder, by selecting the log(s) and/or folder(s) and clicking the Download button or Delete under the actions button.
The selected log(s)/folder(s) package will be downloaded in a compressed ZIP file, maintaining its original folder structure.
5.3.7. Actions
Actions can be performed in two ways, Immediate Actions or Scheduled Actions.
Each action is an operation performed directly on a system, having a direct consequence to it (e.g. Restart), meaning that all actions should be planned and performed carefully.
These actions where described in detail in the previous chapters for each widget or page.
| Please refer to the Operations section for more details on Scheduled Actions. |
5.3.8. Alerts
Any issues Fuse has detected with your Content Server will be shown as described here Errors & Alerts.
Besides that, errors and warnings can be expanded to view the details by clicking on top of the Errors and Warnings widget.
5.4. Environments
Environments are logical groups of systems that can be used to make system management easier. An environment can have any number of systems, but all systems in the same environment must have the same cluster ID.
In Fuse you can create environments and associate systems with them in order to have a more logic organization and overview of an Environment
5.4.1. Environments page
The Environments page is where you can view the list of environments and manage them. This page can be accessed by clicking on Environments on the left bar.
On the top, this page shows the averages of some metrics gathered from the systems, including performance, availability, memory and cpu usage, requests, queue time, queue depth and threads usage. Also includes information about the number of errors and warnings in the systems.
Below, there’s a table listing all the environments. The results in this table can be filtered using the search bar above the table or the dropdown next to the search bar. The search bar allows to filter the results in the table by doing a full text search over the name and tags of the systems. The dropdown next to the search bar allows to filter the environments by tag.
You can click on the names of the environments in the table to view more information about a particular environment.
It’s also possible to sort the systems by name by clicking on the arrows after the Name header. On the bottom of the table you can navigate between the result pages and change the number of environments shown per page.
5.4.2. Creating a new Environment
To create a new environment:
-
Click on Environments on the left bar to access the environments page
-
Click on Add environment on the top of the page.
-
Fill the details of the new environment:
Field Description Name
Environment name (e.g. "DEV")
(Optional) Description
Environment description to help environment identification (e.g. "Partner environment")
Advanced Options
(Optional) Owners
Environment owner(s) email(s) (e.g. "john.doe@company.com"), for event email notifications
(Optional) Tags
Environment tags (e.g. "partner", "dev")
5.4.3. Deleting an Environment
To delete an environment:
-
Click on Environments on the left bar to access the environments page
-
Find the environment to delete in table listing
If you are looking for a specific environment, you can use the search bar above the table to filter the results. -
On the row of the environment to delete, mouse over the button in the Actions column of the table. A few options should appear - choose Delete.
-
A pop-up will appear asking for confirmation. Choose Yes to delete the system
5.4.4. Editing an Environment
To edit an environment:
-
Click on Environments on the left bar to access the environments page.
-
Find the environment to delete in table listing.
If you are looking for a specific environment, you can use the search bar above the table to filter the results. -
On the row of the environment to delete, mouse over the button in the Actions column of the table. A few options should appear - choose Edit.
-
A pop-up will appear with the environment information. Update the desired fields and click Finish to save the changes.
Refer to Creating a new Environment for a more detailed description of the each of the fields.
5.5. Environment Detail
This page shows you details about an environment.
On the left to the page there’s a summary of the performance and availability of the systems in this environment. There’s also an error and warnings counter of all the systems. You can click on the errors and warnings section to view more info, namely what those warnings and errors are and when they happened. Below the errors and warnings you can see information about the cluster, namely what application is running, which database it is using, the CPU and the total memory. Each one of these informations can be clicked to get access to more info.
To the right of the page there are 3 tabs where you can see more information about this environment:
-
The Systems tabs shows a graph with the performance, availability, errors and warnings in this environment over time. Below the graph there is a table with a list of systems in this environemnt. You can use the controls at the top of the table to filter the systems in this list by tag, name and status. Each system in the list can be selected by clicking in the checkbox next to its name. Selecting one or more systems will enable the Actions button which allows to Restart the selected systems, or Generate a systems report, which will generate a system report for each of the systems selected.
-
The Components tab shows information about the different components of the systems in the environment.
-
The Operations tab shows the operations that were recently run on the systems of this environment as well as the ones scheduled.
5.6. Service Report
The Service Report feature, available in Environments List and in Environment details pages, allows users to generate an automatically created report describing the customer’s OpenText application status, availability and performance for one or multiple environments, covering periods up to the last 15 days.
This report provides information regarding status, health, detected alerts and the efficiency of the OpenText Content Suite infrastructure.
To generate a Service Report, initiate the Service Report generation modal by clicking in the Service Report button, available on the header of Environments list or Environment details page.
After the modal is open, fill the required fields:
-
Select one or multiple Environments to include in the report.
-
Choose the report period.
-
Optionally, you can send the report by email.
-
Environemnt owners will be automatically added to the recipient emails list.
-
You can add more recipient emails as you like.
-
-
Click on Generate Report. This action may take some minutes to complete.
-
After complete, you can Download the report.
-
If you selected the option to send the report by email, an email will be sent to each on of the recipients with the report attached
-
5.7. Configuration Policies
It is possible to create pre-defined configuration sets that you can apply to one or more systems, allowing a controlled and consistent way to push and ensure its consistency across your managed systems.
With this configuration management you are able to store, apply and switch configurations across your systems without needing to do it manually.
5.7.1. Create Policy
Policies are created based on existing system configurations (used as template), which you can always customize later. This allows you to clone and distribute configurations across your system landscape.
To create a Configuration Policy:
-
Click Configuration Policies on the navigation menu.
-
Click the Add Configuration Policy (top right button).
-
Enter an explicit Policy Name.
-
Select a configuration baseline system and optionally select and/or adjust the settings you want to add to your policy:
-
Date Settings
-
Performance Settings
-
Security Parameters
-
-
Optionally, select one or more systems to which this policy will apply.
-
Click Finish.
After that, the policy will be displayed in the left panel list. For each list element, you can:
-
See the policy overview (name, number of systems, compliancy status).
-
See a list of systems configured for that policy (by clicking).
-
Edit a policy (Edit Policy).
-
Activate and deactivate policy monitoring (Monitoring Policy).
-
Delete policy (Delete Policy).
-
Apply Policy (Apply Policy).
-
Check non-compliant system configurations (Non-Compliance Mode)
5.7.2. Add configuration to Policy
Add configurations to a policy already created it’s also possible. For that you just need to:
-
Go to the system configuration page from where you want to copy configurations.
-
Select all configurations desired.
-
Click on Add Configuration Policy button.
-
Select the policy where you want to add those selected configurations.
| If you selected configurations that already exists in the policy, those policy configurations will be overridden by the value of the new ones. |
5.7.3. Remove configurations from Policy
If you want to remove one or multiple configurations from a policy, follow these steps:
-
Click Configuration Policies on the navigation menu.
-
Search the policy in the left panel list.
-
Select the edit policy action in the context menu of the policy.
-
The policy edition wizard will come up.
-
In step 2 of the wizard, you have the current list of configurations of the policy.
-
All configurations will be selected by default, unselect the ones you want to remove.
-
Save the policy by finishing the wizard.
5.7.4. Delete Policy
To delete a Configuration Policy:
-
Click Configuration Policies on the navigation menu.
-
Search the policy in the left panel list.
-
Select the delete policy action.
After that, the policy will be deleted.
5.7.5. Edit Policy
When editing you can opt by 2 different things:
-
Edit the policy baseline attributes: name, systems and baseline configurations (like Create Policy)
-
Edit only the existing policy configurations values (keep the other policy attributes as they are)
Edit Policy baseline attributes
To edit the baseline attributes:
-
Click Configuration Policies on the navigation menu.
-
Search the policy in the left panel list.
-
Select the edit policy action.
After that, you will see the same wizard as Create Policy. Make the changes you want and them click on finish to save those changes
| When editing a policy, the second wizard step give a new alternative Select a configuration baseline system. If selected, the actual policy configuration will be overridden by a new one that you can select here. |
| If policy monitoring is activated, once a Configuration Policy is saved, you will be asked to apply the changes to its systems, where you can opt to apply immediately or schedule to apply it later. |
Edit Policy Configurations values
To edit the Policy Configurations values:
-
Click Configuration Policies on the navigation menu.
-
Search the policy in the left panel list and click on it.
-
On the right panel you can see the policy configurations and respective values. Make the desired changes.
| The configurations viewer allows you to filter for any items in the configuration, highlighting all results matching your search filter. |
-
Click on Save Configuration Policy button.
| If policy monitoring is activated, once a Configuration Policy is saved, you will be asked to apply the changes to its systems, where you can opt to apply immediately or schedule to apply it later. |
5.7.6. Apply Policy
As described previously, policies are created with a configuration based on specific system. If wanted you can easily apply those policy configurations to all the policy systems. To apply the policy configurations to the policy systems:
-
Click Configuration Policies on the navigation menu.
-
Search the policy in the left panel list and click on it.
-
On the right panel click on Apply Policy button.
| If any of the policy configurations required a system restart, you will be asked if you want to apply immediately or schedule to apply it later. |
5.7.7. Monitoring Policies
To activate or deactivate policy monitoring:
-
Click Configuration Policies on the navigation menu.
-
Search the policy in the left panel list.
-
Toggle the button: ON means the monitoring is activated and OFF means the monitoring is deactivated.
After activated, the monitoring process will display, after a few moments the policy compliancy status. The possible status are the following:
-
Validating: monitoring is in progress.
-
Non-compliant: one or more systems have one or more configuration non-compliant with the policy configuration. If desired you can check the list of non-compliant configurations for a specific system by clicking on View Details.
-
Complaint: all systems configurations are compliant with the policy configuration.
| When policy monitoring is activated, events, alerts and notifications are created with the respective policy compliancy status. |
5.7.8. Non-Compliance Mode
On Non-Compliance mode you can see system configurations that are non-compliant with the policy selected.
This mode will be only accessible if policy compliance status is Non-compliant and when this condition is happening, the option View Details will be shown for each system non-compliant. By clicking there, you will enter the non-compliance mode and you would be able to check (side by side) policy configurations against system configurations.
Then on the right panel you’ll have the option to Apply the policy only to the specific system that you are checking.
5.8. Operations
In Fuse Management Central an operation refers to any action (restart, changed configuration, …) executed on systems.
This allow administrators to have a close control over every operation, performed or scheduled, on their system landscape by managing them on this area and optionally following up their status through email notifications.
Administrators can create operations directly from any system component actions, as described along this guide.
To access Operations area, click "Operations" on the navigation menu
|
Only users beloging to Fuse Admin or System Admin roles can execute and/or manage operations. For more details on Fuse Management Central roles, please refer to the Installation and Administration Guide. |
The Operations page is divided in 3 main areas:
5.8.1. Operation Status
For the point of view of Fuse operations are a set of actions executed on just one system or to multiple systems at the same time.
Each operation has a global status that depends on the individually result of each system job that belong to the operation. Based on that, operations can have one of the next status:
-
Finished
All system’s jobs that belong to the operation were completed with success. -
Error
If any of the system’s jobs requests that belong to the operation return an error. -
Canceled
If any of the system’s jobs that belong to the operation returned canceled status or if the operation timeout was reached. -
Failed
If any of the system’s jobs that belong to the operation return failed status. -
Skipped
If all systems that belong to the operation were deactivated. -
Not started
None of the system’s jobs that belong to the operation started. -
Executing
At least one of system’s jobs that belong to the operation is in progress.
5.8.2. Operation Types
In Fuse Management Central scheduled operations are divided in 2 types:
-
Single Execution
The operation will be executed only once on the defined date and time. -
Recurring Execution
The operation will be executed on a recurring schedule.
| Optionally, Administrators can switch to "Advanced Mode", to better fine tune the recurrent schedule. The minimum granularity allowed is minutes, and will allways be executed on the first second |
With those two types, Administrators can easily schedule simple operations (like execute next friday) or more complex ones (like execute every day at midnight) .
5.8.3. Notifications
In Fuse Management Central Administrators can opt to receive operations status notifications. Depending of the configuration selected, notifications will be send or not to a list of users.
When scheduling an operation, Administrators can choose one of the following notification options:
-
Don’t notify (Default)
Don’t send any status notification. -
Notify only if failed
Send a status notification only if a job fails its execution. -
Always notify
Send a status notification whenever the operation is executed or edited.
| By default, when an Administrator opts to receive a status notifications system owners are automatically added to the mailing list. However, the notification recipients list can be customized. |
5.8.4. Operations Overview
The Overview chart provides an at-a-glance view of the status of all operations.

5.8.5. Operations List
All operations in execution or already executed are listed here and can be filtered by:
| Filter | Description |
|---|---|
Full-Text Search |
Filter operations by typing a combination any of the search parameter(s): Status, Job ID, Job Type and/or Owner |
Date Interval |
Filter by range of execution dates |
Status |
Filter by operation status (Finished, Canceled, …) |
Job Type |
Filter by combining operation type (Apply configuration, Restart, …) |
System |
Filter by combining systems where the operation has been executed |
Owner |
Filter by combining operation owners (who has executed the operation) |
Operation Actions
For each operation displayed in the table (Operations List) Administrators can do the following actions:
Operation Details
To obtain more more detailed information:
-
Click on the operation’s Job Id field.
-
Select the View Job Status operation action.
All system jobs included in the operation will be displayed as well as the respective start-time, end-time and status. Each job can also be expanded (by clicking) and a job execution log can be seen.
Delete Operation
To delete operations:
-
Select the "Delete" operation action.
-
Select one or more operations and selecting the "Delete" bulk operation action.
| Only completed operations can be deleted. |
5.8.6. Scheduled Operations
All scheduled operations are listed here and can be filtered by:
| Filter | Description |
|---|---|
Full-Text Search |
Filter operations by typing a combination any of the search parameter(s): Status, Job Type, Schedule Type, System and/or Owner |
Date Interval |
Filter by range of execution dates |
Status |
Filter by operation status (Finished, Canceled, …) |
Schedule Type |
Filter by schedule type (Single or Recurring) |
Job Type |
Filter by combining operation type (Apply configuration, Restart, …) |
System |
Filter by combining systems where the operation has been executed |
Owner |
Filter by combining operation owners (who has executed the operation) |
Scheduled Operation Actions
For each scheduled operation displayed in the table (scheduled operations) Administrators can do the following actions:
Edit - Scheduled Operation
To edit a scheduled operation:
-
Click on the operation’s Operation Id field.
-
Select the Edit scheduled action.
Administrators can see or edit the operation type (Operation Types) and the notification configuration (Notifications)
To save changes:
-
click on the Schedule button
Disable - Scheduled Operation
To disable a scheduled operation:
-
Select the "Disable" scheduled operation action.
-
Select one or more scheduled operation and selecting the "Disable" bulk scheduled operation action.
| Only enabled scheduled operation can be disabled. |
Enable - Scheduled Operation
To enable a scheduled operation:
-
Select the "Enable" scheduled operation action.
-
Select one or more scheduled operations and then select the "Enable" action.
| Only disabled scheduled operations can be enabled. |
Delete - Scheduled Operation
To delete a scheduled operation:
-
Select the "Delete" scheduled operation action.
-
Select one or more scheduled operation and then select the "Delete" action.
Run Now - Scheduled Operation
To run a scheduled operation immediately:
-
Select the "Run Now" scheduled operation action.
-
Select one or more scheduled operation and then selecti the "Run Now" action.
| If executed in a scheduled operation configured as a single operation the respective scheduled operation will be deleted. The same doesn’t happen with recurring operations. |
5.9. Dashboard
Fuse Management Central provides a comprehensive Dashboard Interface which gives you a visual representation of all the Content Servers on your estate.
The dashboard provides you with an overview of your system’s status, it also informs you of running or scheduled operations but most importantly, it consolidates all active alerts that may require your attention.
As an OpenText ™ Content Server administrator you will be able to see e.g. how busy the system is or was at what times and real-time statistics of your systems in any environment.
5.9.1. Overview section
At a glance, you will see overall performance, availability and broad system statistics all from a single place. On the overview section you can see the following widget:
-
Performance chart
-
Availability chart
-
Number of Systems with respective counters of errors and warnings
-
Number of Configuration policies respective with counters of errors and warnings
-
CPU chart
-
Memory chart
-
Heatmap for Threads usage
-
Bar chart with Active sessions
-
Content overview chart
-
Overview of the System object volume
-
Overview of the Distributed agents
-
Overview of the Queue tables
5.9.2. Active alerts sections
On the right side you will have a list of active alerts grouped by System or Environment in some cases. For instance, if a system has alerts, you will have a panel with the system name and a collapsible block with all the alerts of that system.
5.9.3. Operations section
You will have a list of the running Operations and the latest Operations finished. You will also have a list of the next scheduled Operations.
To access the Dashboard, click Dashboard on the navigation menu.
|
You can filter all Dashboard data by Environment, one ore more environments can be selected simultaneously . For added convenience, the applied filter will remain selected even when navigating outside the Dashboard. |
5.10. Time Machine
By default Fuse Management Central is displaying real-time metric data but one can opt to visualize past data.
The Time Machine feature provides all system data, frozen at a specific point in time, meaning that when you enable this feature all system status information is displayed relative the selected point in time.
| Please note that some components are still not Time Machine enabled, such as System Logs and Operations. |
You can activate the Time Machine by:
-
Clicking on Fuse Management Central top header LIVE button.
-
Clicking or zooming in (area selection) on any System or Environment component line chart data (e.g. Threads Usage, System Disks, Memory, …).
To navigate to a specific point in, for which you want to view information using the Time Machine:
-
Click on the select box "You are here" component and select a date and time.
-
Click on a specific Time Machine chart moment.
To disable the Time Machine, click on the top bar Time Machine button.
|
By default, Time Machine long-term metric data are stored for a maximum of 15 days. To extend this period please contact us. |
5.10.1. Timeline
When you open the Time Machine mode, you will see a timeline at the top of the page with a range of 2 days. On this timeline, you will have an overview of errors (red bars) and warnings (yellow bars) over the selected range of time. You can change the timeline range by clicking on the dates below the timeline:
 .
.
Here you can select some predefined ranges such as Last Day, Last Week, Last 2 weeks. Or you can choose a custom range by selecting a date range on the calendar. When you apply a range the timeline will adjust to show only that chosen period of time and it’s on this timeline that you can select a specific point in time.
When you are on Time Machine Mode, you will always be at the specific point in time (represented by a marker "You are here")
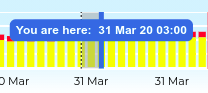
Observing an interval of time before that specific point (represented by the grey area on the previous figure). This interval is configurable, you can select values such as Last 5 minutes, Last 1 hour, Last 24 hours. For instance, if you select the point 30 Mars 20 03:00 and you select an interval of "Last 2 hours", the information presented on the page will show data between 30 Mars 20 01:00 and 30 Mars 20 03:00.
As a typical use case, if someone reports an error during the previous night, with the Time Machine mode, you are able to go back (with a few clicks) to the precise moment where the error happened, and check the state of your system at that moment.
5.10.2. Zoom and Pan
You can zoom via area selection with the mouse in the Time Machine chart.
You can also Pan (option allows you to move the Time Machine date range in any direction within 15 days) by clicking and dragging the mouse.
You can switch between zooming and panning using the button on the top right corner of Time Machine (
 ).
).
After a Zoom in you will have available the Reset Zoom option to reset the Time Machine to its initial zoom state.